“The high cost of housing (71%) is the
most common reason given by voters for wanting to leave California,” polling
director Mark DiCamillo said. “However, high taxes (58%) and the state’s
political culture (46%) are also prominently mentioned, particularly by
Republicans and conservatives.”
Walters: California Paradox:
Economy–and poverty–hit record highs
California’s median income rose to among the nation’s
highest in 2018, but it ranked 50th in housing
By
happenstance, events in the final week of September perfectly framed what one
might call the California Paradox — a thriving, world-class economy with
stubbornly high levels of poverty and a widening divide between the haves and
have-nots.
The
week began with Gov. Gavin Newsom’s keynote address to a United
Nations-sponsored forum on the environment and economic growth, in which he
crowed about California’s economic achievements.
“It’s
an interesting fact, while this country is running $1 trillion-a-year deficits,
California is running historic budget surpluses,” Newsom told the international
audience. “It’s an interesting fact that California has enjoyed the lowest
unemployment rate in its history, more consecutive months of net job creation than
at any time in its history, and significantly outperforming the United States
of America in GDP growth over a five-year period — not despite our
environmental strategies, but because of our environmental strategies.
“As
we change the way we produce and consume energy, it is spawning new companies,
new energy, new growth. We lead in venture capital and green tech. Five to one
— five to one, the number of clean energy jobs in the state of California
versus fossil fuel jobs.”
But
a few days later, the Census Bureau released new state-by-state
data on income and poverty, underscoring once again that California is one
of the leaders in both categories.
While
California’s median personal income rose by 2.3% in 2018 to $75,277, one of the
nation’s highest levels, it was one of only five states in which the “Gini
index,” which measures income inequality, increased.
“New
census figures released today show rising income inequality across the state
and millions of California residents who are struggling to get by on extremely
low incomes, while higher-income households experienced more income growth,”
the California Budget & Policy Center said in its analysis of the
Census Bureau data.
The
organization noted that “from 2006 to 2018, the median household income in California
increased by 6.4%, after adjusting for inflation, but the average real income
for the lowest quintile of households (those in the bottom 20%)
actually decreased by 5.3% while the inflation-adjusted average
income for the top 5% of households increased by 18.6%, or nearly three times
as much as the increase in the median income.”
That
analysis is in line with another recent measure of wellbeing by an organization
called the “Social Progress Imperative.” It merges dozens of economic and other
factors to generate a “social progress index” for nations and their
subdivisions, including states — and California doesn’t fare well.
It
ranks 33rd among states and not surprisingly, its housing crisis is a
major reason why. The index places it at 49th in the category of “basic
human needs,” which includes a 50th place in “shelter.”
Finally,
a few days after Newsom bragged about California’s economic achievements to the
elite economic gathering in New York, UC Berkeley’s Institute of Governmental
Studies released its latest poll, revealing that half of the state’s
voters have considered leaving the state.
“The
high cost of housing (71%) is the most common reason given by voters for
wanting to leave California,” polling director Mark DiCamillo said. “However,
high taxes (58%) and the state’s political culture (46%) are also prominently
mentioned, particularly by Republicans and conservatives.”
Moreover,
just 50 percent of those surveyed agree that California is now the best place
to live.
There
you have it, the California Paradox.
The 50
most miserable cities in America
50. Lancaster, California
49. St Louis, Missouri
48. Pasadena, Texas
47. Macon-Bibb County, Georgia
46. Danville, Virginia
45. Shreveport, Louisiana
44. Hemet, California
43. Mansfield, Ohio
42. San Bernardino, California
41. Compton, California
40. Montebello, California
39. Harlingen, Texas
38. Reading, Pennsylvania
37. Hallandale Beach, Florida
36. Palmdale, California
35. Anderson, Indiana
34. Fort Pierce, Florida
33. North Miami Beach, Florida
32. Jackson, Mississippi
31. Saginaw, Michigan
30. Plainfield, New Jersey
29. West New York, New Jersey
28. Miami Gardens, Florida
27. Cleveland, Ohio
26. Youngstown, Ohio
25. North Miami, Florida
24. Huntington, West Virginia
23. Hammond, Indiana
22. El Monte, California
21. Lynwood, California
20. Huntsville, Texas
19. Paterson, New Jersey
18. Albany, Georgia
17. Trenton, New Jersey
16. Cicero, Illinois
15. Union City, New Jersey
14. Bell Gardens, California
13. Hialeah, Florida
12. Brownsville, Texas
11. New Brunswick, New Jersey
10. Huntington Park, California
9. Warren, Ohio
8. Camden, New Jersey
7. Flint, Michigan
6. Pine Bluff, Arkansas
5. Newark, New Jersey
4. Passaic, New Jersey
3. Detroit, Michigan
2. Port Arthur, Texas
1. Gary, Indiana
The 50
most miserable cities in America
·
The
most miserable city in the US is Gary, Indiana.
·
·
The
state with the most miserable cities is California with 10.
·
·
New
Jersey is close behind with nine, and Florida comes in third with six.
·
These
cities have things in common — few opportunities, devastation from natural disasters,
high crime and addiction rates, and often many abandoned houses.
Not the worst, just the most
miserable.
We've identified the 50 most
miserable cities in the US, using census data from 1,000 cities across the
country, taking into consideration population change (because if people are
leaving it's usually for a good reason), the percentage of people working,
median household incomes, the percentage of people without healthcare, median
commute times, and the number of people living in poverty.
Often, these cities have been
devastated by natural disasters. They've had to deal with blight, and with high
crime rates. Economies have struggled after industry has collapsed. These
cities also tend to have high rates of addiction.
The state with the most miserable
cities was California, with 10 in the top 50. New Jersey was second with nine,
and Florida had six.
Here are the 50 most miserable cities in the US, based on US census data.
Here are the 50 most miserable cities in the US, based on US census data.
50. Lancaster, California
Wikimedia
Lancaster, a desert town, has
almost 160,000 people, 51% of whom work, and 23% of whom live in poverty. It's
had crime problems, both with meth addiction and neo-Nazis. But Mayor R. Rex Parris is doing what he can to kickstart
the city, including looking to China for investment.
49. St Louis, Missouri
Colter
Peterson / St Louis Post-Dispatch / TNS / Getty
St. Louis has almost 303,000
people, but it lost 5% between 2010 and 2018. Sixty-five percent of people work
and one quarter are living in poverty.
The city has had struggled with
crime and gun violence. In 2015, killings rose 33% from the year
before to 159 deaths. The city has
relatively relaxed gun laws, including allowing people to carry loaded guns in
cars without permits. Then-Mayor Francis Slay said crime was the No. 1 priority for
the city.
48. Pasadena, Texas
Chris
Graythen / Getty
Pasadena has 153,000 people, 65%
of whom are working, and one-fifth live in poverty. While the median income is
$50,207, nearly 29% of people don't have health insurance.
Mostly working-class, the city is based near petrochemical plants, and is
known for its race issues. It used to be home to the Texas headquarters of the Ku Klux
Klan. Now, it's divided. In the north it's primarily made up of Latino people
and to the south it's mostly white people.
47. Macon-Bibb County, Georgia
Grant
Blankenship / Macon Telegraph / MCT / Getty
Macon-Bibb County has 153,000
people, but it lost 1.7% of its population between 2010 and 2018. Fifty-six
percent are working, and 26% live in poverty.
One of Macon-Bibb County's
biggest problems is blight. Across the city there are about 3,700 unoccupied buildings, including dilapidated homes and overgrown yards.
46. Danville, Virginia
Michael
Williamson / The Washington Post / Getty
Danville has 40,000 people, but
its population fell by 5.5% between 2010 and 2018. Fifty-five percent of people
are working and 21% live in poverty.
It used to be one of the richest cities in the Piedmont
area. But it's struggled since its
tobacco and textile mills shut down. However, the city is fighting for a
comeback. It's set up solar farms, and its downtown is in the midst of a rehabilitation to turn abandoned warehouses into mixed-use developments.
45. Shreveport, Louisiana
Deputy
Josh Cagle / Bossier Sheriff's Office / Handout / Reuters
Shreveport has about 189,000
people, and lost nearly 6% of its population between 2010 and 2018. Fifty-eight
percent of people work, and 26% are living in poverty.
In 2015, it struggled with floods from the Red River. Its murder rate also doubled from
2015 to 2016, up to 42 murders, and the city
also had an increase in other crimes, like rape, robbery, and aggravated
assault.
44. Hemet, California
Gina
Ferazzi / Los Angeles Times / Getty
Hemet has a population of 85,000
people and between 2010 and 2018, it grew by 8.5%. However, it's struggled
since the 2008 recession. Twenty-three percent of people live in poverty, and
crime rates are high. In 2016, 623 cars were stolen, 170 robberies were
reported, and police logged 398 aggravated assaults — the most this century.
43. Mansfield, Ohio
Eric
Thayer / Reuters
Mansfield has 46,000 residents,
but lost 2.7% between 2010 and 2018. Forty-eight percent of people are working,
and 24% are living in poverty.
It used to have lots of
industrial work, with people making things like steel, machinery, and stoves,
but that dried up in the 1970s and 1980s. More recently, in 2010, a GM factory closed its doors, leading to more job losses. It's also had a surge in crime,
and between 2012 and 2017, violent crimes rose by 37%.
42. San Bernardino, California
AP
Photo/Reed Saxon
Of San Bernardino's 216,000
residents, 57% are employed, and 30% live in poverty.
It's 60 miles east of Los
Angeles, and has an interesting history. It's where McDonalds began, as well as the Hells Angels
motorcycle gang. Along with a tough recession, it had a steel plant and an Air
Force base close down, meaning even fewer jobs.
41. Compton, California
Mario
Anzuoni / Reuters
Compton has 96,000 people, 40% of
whom aren't working, and 23% live in poverty.
The city struggles with poverty
and unemployment. But it's no longer as dangerous as the way it was portrayed
in the film "Straight Outta Compton."
In 1991 there were 87 murders, and in 2014, it was down to 17.
40. Montebello, California
Frederick
J. Brown / AFP / Getty
Of Montebello's 62,632 people,
60% are working, and 14% live in poverty. The average commute time is 33
minutes, and 19% of people don't have health insurance.
A big issue is affordable
housing. A home-ownership counselor told
the New York Times in 2019
that prospects for first-time buyers weren't good, and that opportunities to
live there weren't growing.
39. Harlingen, Texas
Wikimedia
Harlingen has 65,000 residents;
56% are working, and 30% live in poverty.
It's a hot city, with little
rainfall, although recently, it's been
dealing with flooding. It's also one of three cities where 2,000 immigrants were released in
2019, putting pressure on the city to
help them.
38. Reading, Pennsylvania
Michael
Williamson / The Washington Post / Getty
Reading has 88,495 residents,
where almost 62% of people are working, and 36% live in poverty. In 2011, The
New York Times said it was the poorest city in the US.
Its economy struggled after
factories closed down or downsized, laying people off. An estimated 44% of households are on food
stamps, among the most in the country.
37. Hallandale Beach, Florida
Wikimedia
Hallandale Beach has about 40,000
people, 60% of whom are working; 20% live in poverty. More than 29% of people
are without health insurance.
Halfway between Miami beach and
Fort Lauderdale, it's been called a "once scruffy beach town," by
the Wall Street Journal. It also has plenty of strip clubs and has been nicknamed
"Hound-ale Beach."
36. Palmdale, California
Anne
Cusack / Los Angeles Times / Getty
Palmdale has 156,667 people — 59%
are in the workforce, and 19% live in poverty.
It also has a median commute time
of 42.7 minutes, which is the highest on the list. It was at one point called
"the foreclosure capital of
California."
35. Anderson, Indiana
Wikimedia
Anderson has 55,000 residents,
but lost 2% between 2010 and 2018. Fifty-six percent of people are employed,
and one-quarter live in poverty.
Formerly a thriving GM city with
24 factories, things deteriorated when the carmaker closed factories and 23,000 people lost their jobs. It's also been a city that has been dealing with blight. In
2015, the city was given $2.8 million
to tear down 100 abandoned homes, and
there were hundreds more that could have qualified.
34. Fort Pierce, Florida
Michael
S. Williamson / The Washington Post / Getty
Fort Pierce has 46,000 people,
and grew by almost 10% between 2010 and 2018. Just over half of people there
are employed, and almost 36% of people in poverty.
This city used to have an economy based around citrus
farming, but struggled with diseases and
the effects of trade deals. It also has to replenish the sand on its beaches every few years, because of ocean erosion.
33. North Miami Beach, Florida
Wikimedia
North Miami Beach has almost
46,000 people; 65% are working, and just under 20% are living in poverty. But
32% of residents don't have healthcare, and the average commute time is 31
minutes.
Another issue for living in this
area could be the tumultuous politics — two recent mayors have faced
criminal charges for their spending.
32. Jackson, Mississippi
Jonathon
Bachman / Reuters
Jackson has almost 165,000
residents, but between 2010 and 2018 it lost more than 5% of its population.
Sixty-two percent of the population is working, and almost 29% live in poverty.
In February, the city threatened to cut off
water for 20,000 people,
because $45 million worth of bills hadn't been paid. Mayor Chokwe Antar Lumumba, elected in
2017, said his goal was to make the city the "most radical" on
Earth, by taking on issues like
poverty in new ways.
31. Saginaw, Michigan
Wikimedia
Saginaw has 48,000 people, and
between 2010 and 2018 it lost 6% of its population. Fifty-five percent of
people are working and nearly 34% are living in poverty.
Like many other cities on this
list, it used to have a lot of manufacturing jobs — at one point around 25,000 with
General Motors. But they didn't last.
Some locals reportedly refer to
the city as "sag-nasty" because of its issues with crime. In May 2019, violent crime had fallen in the city, with 16 shootings to date, compared to 30 at
that point in 2018.
30. Plainfield, New Jersey
Wikimedia
Plainfield has 50,693 people, 70%
of whom are working, and one-fifth of whom live in poverty. Nearly one-third
are without health insurance, and the median commute time is 31 minutes.
It used to be a violent city — in
1990 there were 719 violent crimes, but since then things have improved, although in 2016 there
were 12 murders.
29. West New York, New Jersey
Eduardo
Munoz / Reuters
West New York has nearly 53,000
people, and it grew by 6.6% between 2010 and 2018. Almost 70% are working, and
22% are living in poverty.
Cleanliness and parking are meant to be two of the biggest issues for its new
mayor. The median commute time is 37 minutes.
28. Miami Gardens, Florida
Joe
Skipper / Reuters
Miami Gardens has 113,000 people
— 60% are working, while about 22% live in poverty.
In 2014, it was called the "stop and frisk capital of
America," after an investigation
showed nearly 57,000 people had been frisked since 2008.
Another issue in the area is the
cost of water. Because it comes from a plant owned by the City of North Miami
Beach, the cost of living is a little bit higher. In March, the city was suing
to fight the extra 25% surcharge.
27. Cleveland, Ohio
Benjamin
Lowy / Getty
Cleveland, sometimes called the
"mistake by the lake", has 384,000 people. Its population fell 3% between 2010
and 2018. Nearly 59% of the population is working, and 35% live in poverty. An
August 2019 report found that half of those living in poverty
are working.
The city has struggled for years
since losing the bulk of its manufacturing industry. In 2010, Forbes said it was the most
miserable city in the US. It
also had a bad year for gun violence in 2015, with 85 gun homicides.
26. Youngstown, Ohio
Brian
Snyder / Reuters
Youngstown has about 65,000
people, and lost 3% of its population between 2010 and 2018. Just over half of
its population is working and nearly 37% of people live in poverty.
It used to have a population of
170,000, and was the third biggest steel producer in
the United States, until the
factory began downsizing from 1977 onward. It was also recorded as having some
of the worst air pollution in Ohio in 2017.
25. North Miami, Florida
Carlo
Allegri / Reuters
North Miami has about 63,000
people, 65% of whom are working, while 23% in poverty.
One of the big issues it faces is
flooding, even when it doesn't rain. Sometimes, all that's necessary for flooding is a full
moon. It is also facing problems
around septic tanks (the city has 2,780) that soon might not be able to operate
properly, because of rising sea levels. This could result in wastewater ending up in yards and
other places it's not meant to be.
24. Huntington, West Virginia
Lexi
Browning / Reuters
Huntington has 46,000 people, and
it lost 6.4% of its population between 2010 and 2018. Just over half are
working, and about a third live in poverty.
Formerly a thriving coal mining
town with 90,000 people in 1950, it has since fallen on harder times. In 2008, the city was
described as the unhealthiest in America. The severe opioid crisis has led Huntington to be named America's overdose capital. But overdoses have fallen since 2017.
23. Hammond, Indiana
Scott
Olson / Getty
Hammond has about 76,000 people,
and its population fell by 6.2% between 2010 and 2018, Sixty-one
percent of people are in the labor force, and 22% live in poverty.
A 2014 study found the city was
one of the most industrial in the state, and as a result had problems with air and water
pollution. Lead contamination has been a particular concern for residents.
22. El Monte, California
Wikimedia
El Monte has 115,000 residents;
58% of its population is working, and 22% live in poverty. The average commute
time is a half hour.
The city, which is located near
two freeways and close to Los Angeles, had a lot of revenue coming in from car
dealerships, but struggled during the recession, when three dealerships closed, and the city's tax revenue
fell. It's continued to have issues with finances, and the city is now divided
over the future of marijuana production — one large facility in particular.
21. Lynwood, California
Lawrence
K. Ho / Los Angeles Times / Getty
Lynwood has 70,500 residents —
60% work and 23% are impoverished. It was once called "the best place to
live best." But things didn't stay that way.
The construction of Interstate
105, which cut right through the city, caused many to leave their homes, and 1,000 homes and
businesses to be knocked down. More recently, officials have struggled to manage the city's finances, resulting in losses that could have been used to help the
city.
20. Huntsville, Texas
Richard
Carson / Reuters
Huntsville has 41,500 residents;
39% of its people are working, and almost 35% live in poverty. However, the low
employment is in part because those living in prisons are counted in the city's
population.
The Department of Criminal
Justice is the city's biggest employer, providing nearly 7,000 jobs. Since 1999, Texas' executions have been done
exclusively out of Huntsville.
19. Paterson, New Jersey
Eric Thayer
/ Reuters
Paterson has 145,000 residents,
57.5% of its population is working, and 29% live in poverty.
It used to produce silk in
the 19th century, but it's since struggled. In a cruel twist of fate, the Great Falls, which was used
to power factories, ended up flooding the city after Hurricane Irene in 2011.
Between 2009 and 2016, the city's tax revenue fell by
38%. It's also had problems with blight — at one point it had 1,250 abandoned homes, but that
dropped to 770 in 2016.
18. Albany, Georgia
Tami
Chappell / Reuters
Nicknamed "the good life
city," Albany has 75,000 people, although its population fell by almost 3%
between 2010 and 2018. Nearly 58% of the population is working, and a third
live in poverty.
Along with poverty and crime, it
also has been dealing with severe damage and
ruined crops from a severe tornado and
Hurricane Irma in the last few years.
17. Trenton, New Jersey
Eduardo
Munoz / Reuters
Trenton has a population of
84,000. Almost 60% of people are working, and 27% are living in poverty.
It used to be an industrial city
with a catchphrase, "Trenton makes, the world takes," but has since fallen on harder times. Its violent crime
isn't increasing, but neighborhood gangs have been known to fight each other,
and gun violence is a problem.
16. Cicero, Illinois
Scott
Olson / Getty
Cicero has 81,500 residents, but
that fell by 3% between 2010 and 2018. Two-thirds of people are working and
just under 20% live in poverty. The median commute time is 31 minutes.
It's known for being Al Capone's "private
playground" back in the
1920s, and since then, the city has fought the nickname and crime. In 1999, the
city even voted to make gang members leave within 60 days, or face a daily $500 fine.
15. Union City, New Jersey
Eduardo
Munoz / Reuters
Union City has 68,500 residents,
almost 70% are working, while 23% live in poverty. The average commute time is
33 minutes long.
The city is known by some as
"Havana on the Hudson," due to 80% of its residents identifying as
Hispanic, many of whom fled from Cuba. It's only 1.28 square miles, making it
one of the most densely populated areas in
the US.
14. Bell Gardens, California
Allen
J. Schaben / Los Angeles Times / Getty
Bell Gardens has 42,300
residents; 63% of people working, and almost 30% are living in poverty.
According to a city official in
1991, the problem with the city was too
many people. The city has had to depend on a
casino for much of its tax revenue — in 2002, it provided more than
half.
13. Hialeah, Florida
C. M.
Guerrero / Miami Herald / TNS / Getty
Hialeah has 239,000 residents —
56% of whom are working, while almost 26% live in poverty. Nearly 31% don't
have health insurance.
With a primarily Hispanic
population, it's one of the least diverse cities in the country. It's also been rated as the worst city in the US for having
an active lifestyle.
12. Brownsville, Texas
Sergio
Flores / AFP / Getty
Brownsville has 183,000 residents,
56% of people are working, and more than 31% of people are living in poverty.
More than 35% don't have health insurance.
The city is on the Mexican
border, and often has unauthorized immigrants passing through, making it one of the most patrolled places
in the country. According
to locals, three different types of
helicopter fly overhead. Concern
around immigration has also made it difficult for some
residents to sell their properties.
11. New Brunswick, New Jersey
Wikimedia
New Brunswick has 56,000
residents, 54% of people are working, and 35% are living in poverty. It has had
problems with crime – In 2017, the city's assaults with guns
rose 64%.
10. Huntington Park, California
Allen
J. Schaben / Los Angeles Times / Getty
Huntington Park, the 10th most
miserable city in the US, has 58,000 residents, 63% of people are working, and
28% of people live in poverty. The median commute time is 31 minutes.
It has a checkered history with waste
management. A former waste disposal
facility situated in the community is being cleaned up, but work was suspended
after residents complained about dust
and the smell.
9. Warren, Ohio
Alan
Freed / Reuters
Warren has 38,000 residents, and
its population fell by 7.7% between 2010 and 2018. About half of people are
working, and two-thirds live in poverty.
It's had a slow economy for a while,
but things weren't helped when General Motors announced in 2018 it would stop
work in a plant nearby,
meaning people had to leave the city to find work. Along with Youngstown,
Warren has the second highest rate of people
struggling to find enough food in
the country.
8. Camden, New Jersey
Spencer
Platt / Getty
Camden has 74,000 residents, and
its population fell by 4% between 2010 and 2018. Nearly 57% of people are in
the work force, and 37% live in poverty. The average household income is
$26,105 — the lowest on this list.
It used to be a manufacturing
city, but that fell to pieces between the 1950s and 1970s. It's had a high crime rate and been known as one of the most
dangerous cities in the country, but it is improving. In 2017, there were 22
murders, which was the lowest number since 1987, thanks in part to new police procedures.
7. Flint, Michigan
Rebecca
Cook / Reuters
Flint has 96,000 residents, and
it's fallen by 6% between 2010 and 2018. Just over half of people are working,
and 41% of people are living in poverty — the highest on this list.
The city has struggled with a
decline in manufacturing. By 1990, General Motors had
downsized in the area,
leaving many without jobs.
Flint is perhaps best-known for
the water crisis it's been facing
since 2014, where residents were being
poisoned with lead. On top of that, it's got 20,000 abandoned properties to deal with, a consistently high murder rate, and an
opioid problem.
6. Pine Bluff, Arkansas
Wikimedia.
Pine Bluff has 42,000 residents,
and between 2010 and 2018, it lost nearly 14% of its population — the biggest
loss on this list. Fifty-two percent of people are working, and 30% are living
in poverty.
People have been leaving due to
the state losing almost 3,000 manufacturing
jobs between 2016 and 2017. In
2019, things deteriorated further when the Arkansas River flooded the city.
5. Newark, New Jersey
Kathy
Willens/AP Photo
Newark has 282,000 residents, 62%
are working, and 28% are living in poverty. The median commute time is over 35
minutes long.
Like Flint, it's had problems with lead poisoning its water supply. The city has also struggled with race relations, which bubbled up in violent riots
in 1967, and has it's fair share of
violent crimes, particularly in 2013.
4. Passaic, New Jersey
Mark
Makela / Getty
Passaic has 70,000 residents —
58% of people working, and a third are living in poverty.
3. Detroit, Michigan
Joshua
Lott / Reuters
Detroit has 672,000 people, and
between 2010 and 2018, it lost nearly 6%. While 54% of people are working, 38%
live in poverty. The median household income is $27,838.
The city already lost many of its
residents between 1950 and 1980, when 600,000 people left after the manufacturing industry collapsed. With 43,000 abandoned homes, it's been struggling with blight, and is considered one of
the most dangerous cities in the
United States.
2. Port Arthur, Texas
Michael
S. Williamson / The Washington Post / Getty
Port Arthur, a city surrounded by
oil refineries, has 55,000 residents. Fifty-three percent are working and 30%
are living in poverty.
The city was hit by hurricanes in
2005, 2008, and 2017. Harvey, the latest, caused $1.3 billion in damage. Officials fear that if people keep leaving, Port Arthur will
fall below 50,000 people and make it ineligible for federal
grants.
1. Gary, Indiana
Eric
Thayer / Reuters
Gary has 75,000 residents, but
lost 6% between 2010 and 2018. Just over half of the population works, and 36%
live in poverty. The most miserable city in the US was once a manufacturing
mecca, but those days are over.
A drug enforcement agent who grew
up in the area told The Guardian in 2017: "We used to be the murder
capital of the US, but there is hardly anybody left to kill. We used to be the
drug capital of the US, but for that you need money, and there aren't jobs or
things to steal here."
When the jobs dried up, most
white people left, and now 84% of people living in Gary are
African American. The city is
experimenting with number of plans to try and revitalize the area, including selling abandoned homes for $1.
Los Angeles County Pays
Over a Billion in Welfare to Illegal Aliens Over Two Years
In 2015 and 2016, Los Angeles County paid
nearly $1.3 billion in welfare funds to illegal aliens and their families. That
figure amounts to 25 percent of the total spent on the county’s entire needy
population, according to Fox News.
The state of California is home to more illegal aliens than any other
state in the country. Approximately one in five illegal aliens lives in
California, Pew reported.
Approximately a quarter of California’s 4 million illegal immigrants
reside in Los Angeles County. The county allows illegal immigrant parents with
children born in the United States to seek welfare and food stamp benefits.
The welfare benefits data acquired by Fox News comes from the Los
Angeles County Department of Public Social Services and shows welfare and food
stamp costs for the county’s entire population were $3.1 billion in 2015, $2.9
billion in 2016.
The data also shows that during the first five months of 2017, more than
60,000 families received a total of $181 million.
Over 58,000 families received a total of $602 million in benefits in
2015 and more than 64,000 families received a total of $675 million in 2016.
Robert Rector, a Heritage Foundation senior
fellow who studies poverty and illegal immigration, told Fox the costs represent “the tip of
the iceberg.”
“They get $3 in benefits for every $1 they spend,” Rector said. It can
cost the government a total of $24,000 per year per family to pay for things
like education, police, fire, medical, and subsidized housing.
In February of 2019, the Los Angeles city council signed a resolution
making it a sanctuary city. The resolution did not provide any new legal
protections to their immigrants, but instead solidified existing policies.
In October 2017, former California governor
Jerry Brown signed SB 54 into law. This bill made
California, in Brown’s own words, a “sanctuary state.” The Justice
Department filed a lawsuit against the State of California over the law. A
federal judge dismissed that suit in July. SB 54 took effect on Jan.
1, 2018.
According to Center for
Immigration Studies, “The new law
does many things: It forbids all localities from cooperating with ICE detainer
notices, it bars any law enforcement officer from participating in the
popular 287(g) program, and it prevents state and local police
from inquiring about individuals’ immigration status.”
Some counties in California have protested its implementation and joined
the Trump administration’s lawsuit against the state.
California’s campaign to provide public services to illegal immigrants
did not end with the exit of Jerry Brown. His successor, Gavin Newsom, is
just as focused as Brown in funding programs for illegal residents at the
expense of California taxpayers.
California’s budget earmarks millions of dollars annually to the One
California program, which provides free legal assistance to all aliens,
including those facing deportation, and makes California’s public universities
easier for illegal-alien students to attend.
According to the Fiscal Burden of Illegal
Immigration on United States Taxpayers 2017 report, for the estimated 12.5 million illegal
immigrants living in the country, the resulting cost is a $116
billion burden on the national economy and taxpayers each year, after
deducting the $19 billion in taxes paid by some of those illegal immigrants.
BLOG: MOST FIGURES PUT THE NUMBER OF
ILLEGALS IN THE U.S. AT ABOUT 40 MILLION. WHEN THESE PEOPLE ARE HANDED AMNESTY,
THEY ARE LEGALLY ENTITLED TO BRING UP THE REST OF THEIR FAMILY EFFECTIVELY
LEAVING MEXICO DESERTED.
New data from the U.S. Census Bureau shows that more than 22 million
non-citizens now live in the United States.
“MORE
THAN 10 MILLION” ILLEGALS IN CALIFORNIA ALONE
Xavier Becerra breaks the
news, files suit against Trump administration public-charge rule.
August
19, 2019
More than 22 million
people are illegally present in the United States, according to a recent study
by scholars at MIT and Yale. Pew Research pegged the figure at 11 million, and for years
it stood as the official count for media and government. It now emerges that 11
million is more like the number illegally present in California alone.
“California is home to
over 10 million immigrants,” reads a chart displayed by California attorney
general Xavier Becerra and governor Gavin Newsom as they announced a lawsuit against the Trump administration’s public-charge rule.
“Immigrants,” is California code for “illegals,” a term the state’s ruling class
has banned. As Rachel Bovard notes at American Greatness, even a legal
immigrant’s ability “to stay off the welfare system must be taken into account
when considering qualifications for a green card.”
California heaps welfare
benefits on those illegally present, including nearly $100 million for health care in the recent budget. Many of those 10 million illegals
came to California specifically to get those taxpayer-funded benefits. It
disturbs Becerra and Newsom that this disqualifies the recipients from any
future legal status, but there’s more to it. As attorney Madison Gesiotto explains in The Hill, voting must also be taken
into account.
“Voting as an illegal
alien in federal elections is a crime punishable by fine, imprisonment,
deportation, or inadmissibility.” According to a State Department investigation, false-documented illegals have been voting in federal, state
and local elections for decades. In 1996, illegals cast 784 votes against Republican Robert Dornan in a congressional race
Democrat Loretta Sanchez won by only 984 votes.
If Newsom and Becerra are
certain that more than 10 million people illegally reside in the state, they
doubtless know how many voted in 2016. Trouble is, California Secretary of
State Alex Padilla refused to release any voter information to a federal
voter-fraud probe.
Back in 2015, Padilla
told the Los Angeles Times, “At the latest, for the 2018 election
cycle, I expect millions of new voters on the rolls in the state of
California,” with “new voters” code for ineligible voters. True to form, by
March, 2018, more than one million “undocumented” immigrants received driver’s licenses from the state Department of
Motor Vehicles, which automatically registered them to vote under the “Motor
Voter” program.
Padilla is now claiming
that only six “California residents” were erroneously added to voter rolls for 2018, that it
was all due to DMV errors, and that none was guilty of “fraudulently voting or
attempting to vote.” To paraphrase John Goodman in The Big Lebowski,
this is what happens when the governor’s own department of finance, not the
official state auditor, investigates the DMV.
In reality, California
officials know full well how many non-citizens voted in 2016 and 2018. With
more than 10 million illegals in the state, the ballpark figure of one million
illegal voters is probably low. In California, illegals are the Democrats’
electoral college, and the Democrats reward them with welfare benefits and
protection from deportation through sanctuary laws. This raises another issue.
Illegals’ use of welfare
benefits and practice of voting in federal elections disqualifies them from
legal residency and citizenship. This makes for a permanent group of more than
10 million foreign nationals in California alone. In these conditions, Congress
should start pushing back.
Public officials who
apportion taxpayer-funded benefits for foreign nationals should be required to
register as agents of the governments of those foreign nationals. The primary
candidates would be the governments of Mexico, Honduras, Guatemala and El
Salvador, which Gavin Newsom visited before he had even toured his own state.
State and federal
governments should also bill the foreign governments for welfare, medical,
education and incarceration costs. Some of this could be alleviated by a
tax on remissions, such as the 33.4 billion Mexicans
abroad sent back last year. That amount is impossible without massive
inputs from U.S. taxpayers. Legitimate citizens and legal immigrants have no
obligation to relieve foreign governments of responsibility for their own
citizens.
Meanwhile, as Rachel
Bovard also notes, the Trump administration’s new rule only updates a 1996 law
proclaiming “inadmissible” those aliens likely to become a public charge. The
law was supported by Nancy Pelosi, Chuck Schumer, Joe Biden and other leading
Democrats. The Trump administration measure gives more definition to what
constitutes a welfare benefit, food stamps, Medicaid, public housing assistance
and such. Those benefits are all for legitimate citizens and legal immigrants
but Bovard cites Census data showing that 63 percent of non-citizens use the
welfare system.
Those who thought there
were only 11 million illegals nationwide were mistaken. Thanks to Jerry Brown
crony Gavin Newsom, and Xavier Becerra, once on Hillary Clinton’s short list as
a running mate, Americans now understand that “more than 10 million” illegally
reside in California alone, and that might understate the figure.
The MIT-Yale estimate
ranges as high as 29.1 million nationwide, more than the population of Australia, with 25,088,636 and a veritable occupation. To all but the willfully
blind, politicians have abandoned the rule of law, and made false-documented
illegals a protected, privileged class.
This is how a nation
loses its sovereignty.
Census Bureau:
Immigration Driving Half of
U.S. Population Growth
2:43
Immigration to
the United States is now driving nearly half of all population growth in the
country instead of increased birth rates, the U.S. Census Bureau finds.
The latest Census Bureau
estimates on the U.S. population reveal that about 48.5 percent of all
population growth is driven by the country’s mass illegal and legal immigration
policy, where more than 1.5 million foreign nationals are admitted to the
country every year.
(Axios)
Axios analysis by Stef Knight details the growing share to which
immigration is increasingly driving population growth across the U.S. Since
2011, for example, the level to which immigration has accounted for overall
population growth has increased more than 13 percent.
According to the Wall
Street Journal analysis, about nine percent of U.S. counties
are growing solely because of immigration.
This concludes that about nine percent of counties have regional birth rates
that do not exceed the annual number of deaths in the area.
Similarly, the Wall
Street Journal notes, more than half of all population growth in
states like Florida, Ohio, Virginia, Kansas, and Michigan, among others, is
because of immigration.
Though pundits have
claimed that the country’s admittance of 1.2 million legal immigrants a year is
necessary to increase birth rates, researchers have found that the growth of
the immigrant population has little impact on birth rates.
Center for Immigration
Studies Director of Research Steven Camarota discovered in his latest study this year that
“immigrant fertility has only a small impact on the nation’s overall birth
rate,” citing that immigrants in the U.S. raise the nation’s birth rate for all
women by two births per 1,000 women.
“Immigration has a minor
impact because the difference between immigrant and native fertility is too
small to significantly change the nation’s overall birth rate,” Camarota noted
in the study.
At current legal
immigration levels, the U.S.
million residents by 2060 — including a foreign-
born population of 69 million.
The U.S. does not have
to rapidly increase its total
resident population and foreign-born population,
as legal immigration moratoriums have
arrivals to properly assimilate to American life.
Halting all immigration to the country would
stabilize the population to a comfortable 329
million residents in the next four decades.
OF COURSE,
THEY REALLY HAVE NO IDEA HOW MANY HAVE JUMPED OUR BORDERS!
“Between 2005 and 2017, chain
migration, alone, brought nearly 10 million foreign nationals to the U.S.”
DOJ: Federal Arrests of Foreigners More than Tripled in Last 20 Years
DOJ: Federal Arrests of Foreigners More Than
Tripled in Last 20 Years
As Breitbart News reported, though non-U.S.
citizens represent just seven percent of the total U.S. population, they
accounted for 15 percent of all federal arrests and 15 percent of all
prosecutions for non-immigration related crimes in 2018. This indicates that
non-U.S. citizens were about 2.3 times as likely to be arrested or prosecuted
for non-immigration related crimes.
For non-immigration offenses, the total of federal arrests for
non-U.S. citizens between 1998 and 2018 increased nearly eight percent, and
between 2017 and 2018 rose almost ten percent.
Non-U.S. citizens were most likely to be prosecuted for illegal
re-entry, that is illegal aliens who have been previously deported, drugs,
fraud, alien smuggling, and misuse of visas.
A 2018 Government Accountability
Office (GAO) report discovered nearly all
illegal and legal immigrants in U.S. federal prisons are from Mexico, Honduras,
El Salvador, the Dominican Republic, Colombia, and Guatemala.
Between 2010 and 2015, the average annual cost to incarcerate
criminal illegal and legal immigrants slightly decreased — as the criminal
alien population slightly decreased as well — from $1.56 billion to about $1.42
billion. That cost is paid for by American taxpayers who are forced to offset
the costs of mass immigration to the country.
Every year, the U.S. admits more
than 1.5 million foreign nationals, with the overwhelming majority arriving
through the process known as “chain migration,” whereby newly
naturalized are able to bring an unlimited number of foreign relatives to the
country. Between 2005 and 2017, chain migration, alone,
brought nearly 10 million foreign nationals to the U.S.
Ben
Carson Warns of Potential ‘Epidemic’ Among Homeless in California Cities
18 Sep 2019173
2:50
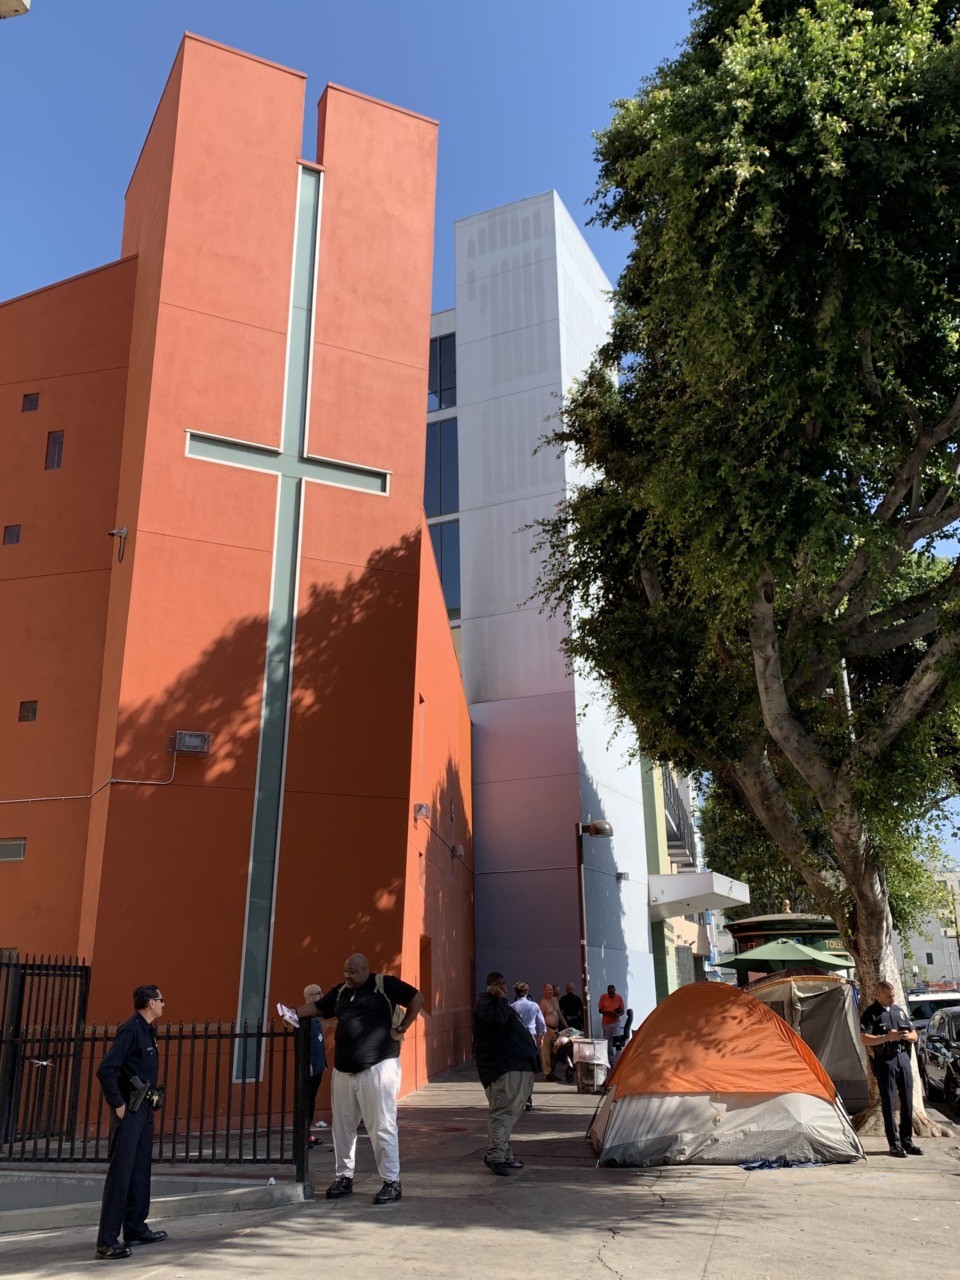
LOS ANGELES, California — Housing and Urban Development Secretary Ben
Carson warned that conditions among homeless people in many California cities
were so bad they could “foster an epidemic, if we’re not careful.”
Carson spoke
to reporters after touring the Union Rescue Mission, a homeless shelter and non-profit organization
on Skid Row in downtown Los Angeles, at the core of the city’s homeless
population of almost 60,000 individuals.
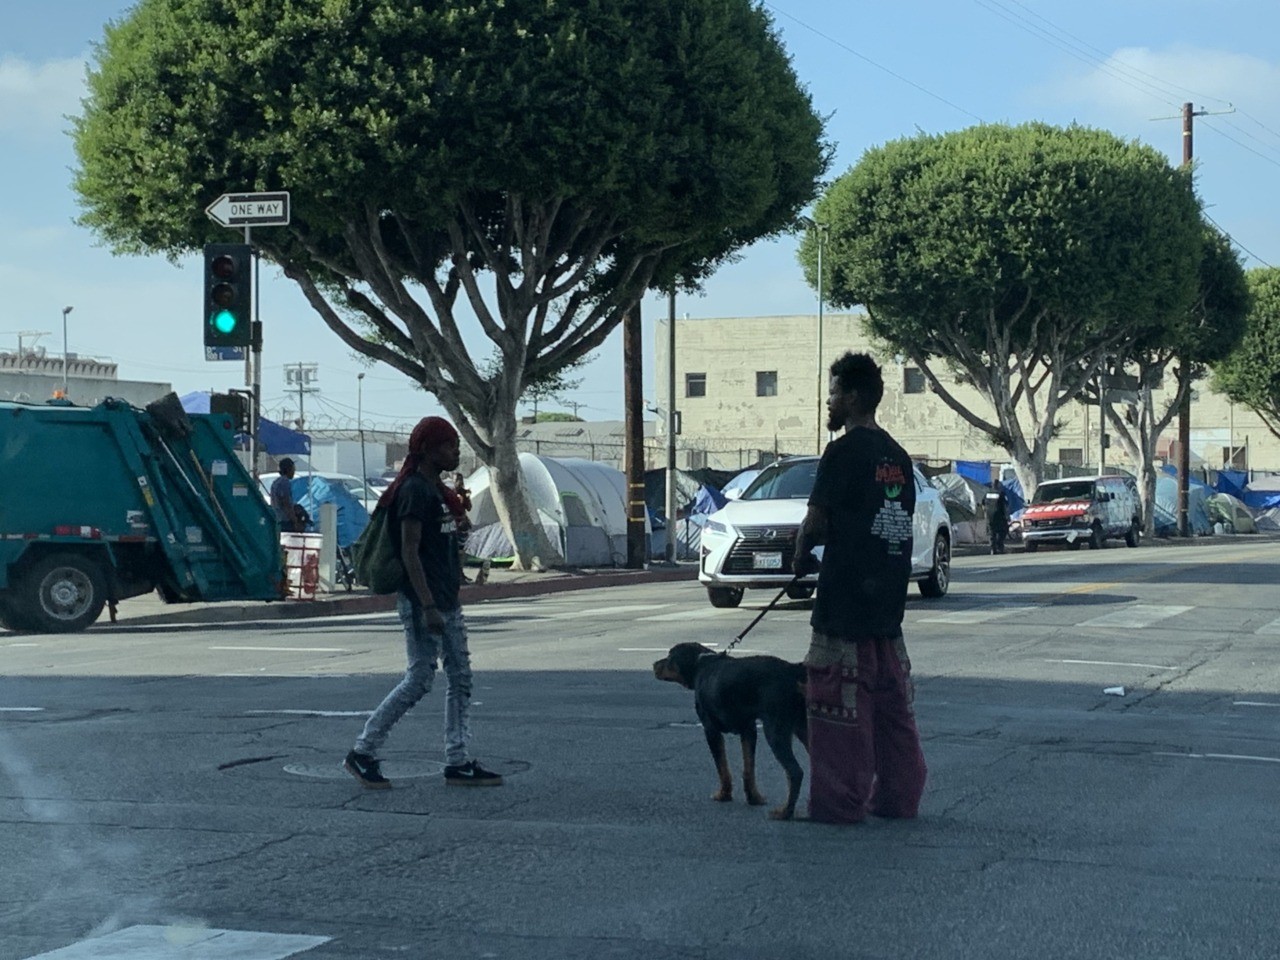
The streets
surrounding the mission are lined with tents and trash. Homeless families sat
on the sidewalks, some in chairs, as cars struggled to navigate the chaos: a
homeless pair of lovers quarreled in the middle of an intersection.
Union Rescue Mission, Skid Row, Los Angeles (Joel Pollak /
Breitbart News)
Homeless couple, L.A. Skid Row (Joel Pollak / Breitbart News)
Last
year, Los Angeles suffered a typhus outbreak that spread from the homeless
population to City Hall. Some, including Dr. Drew Pinsky, are now warning that
L.A. could see an outbreak of bubonic plague, which is endemic.
The
secretary focused his remarks on partnerships between the federal, state, and
local governments, as well as the private sector, in urging Americans to
cooperate to find housing solutions for those who had fallen on hard times.
But
Carson also address the ongoing homeless crisis in California — a crisis that has
led President Donald Trump, who is visiting the state, to suggest emergency
federal intervention, overriding state and local government authority.
The
president could invoke the National Emergencies Act of 1976 and
the Robert T. Stafford Disaster Relief and Emergency Assistance Act of
1988 to intervene. Federal officials reportedly visited the
state last week to look at facilities that could be used to house homeless
people after they had been relocated from the center of the city.
“My
preference, obviously, is to work with the state,” Carson said. “But what we’re
concerned about are the conditions. And these are conditions that … can foster
an epidemic, if we’re not careful. And then, after that occurs, what will
everybody be saying? How come you guys didn’t do anything? You knew all this
was going on?”
Carson
also addressed questions about the eviction of illegal aliens from public
housing, telling reporters that the law not only barred illegal aliens from
living in public housing, but those giving shelter to illegal aliens. The only
solution, he said, was an act of Congress, which could change the law with
“comprehensive immigration reform.”
Update: Secretary Carson also rejected requests
for additional federal funds to the state, arguing that state and local
authorities had to revise zoning regulations that discouraged the building of
additional affordable housing units.
Joel B.
Pollak is Senior Editor-at-Large at Breitbart News. He earned an A.B. in Social
Studies and Environmental Science and Public Policy from Harvard College, and a
J.D. from Harvard Law School. He is a winner of the 2018 Robert Novak
Journalism Alumni Fellowship. He is also the co-author of How Trump Won: The Inside
Story of a Revolution, which is available from Regnery. Follow him on Twitter
at @joelpollak.
Report:
California’s Middle-Class Wages Rise by 1 Percent in 40 Years
Justin
Sullivan/Getty Images
3 Sep 2019172
6:24
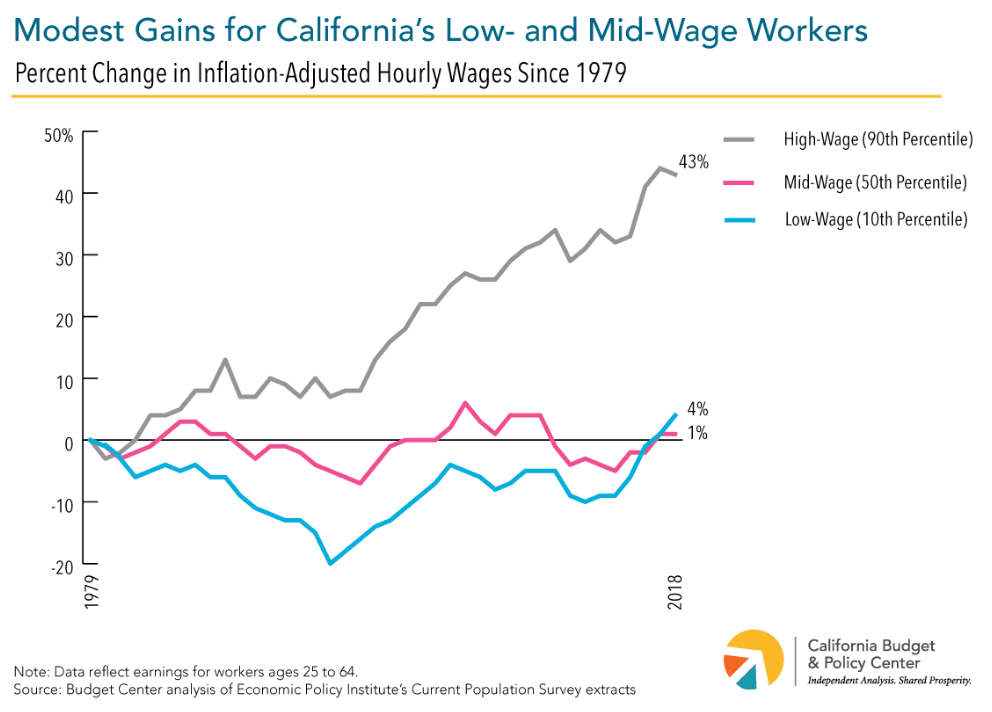
Middle-class wages in
progressive California have risen by 1 percent in the last 40 years, says a
study by the establishment California Budget and Policy Center.
“Earnings for California’s
workers at the low end and middle of the wage scale have generally declined or
stagnated for decades,” says the report, titled “California’s Workers Are
Increasingly Locked Out of the State’s Prosperity.” The report continued:
In
2018, the median hourly earnings for workers ages 25 to 64 was $21.79, just 1%
higher than in 1979, after adjusting for inflation ($21.50, in 2018 dollars)
(Figure 1). Inflation-adjusted hourly earnings for low-wage workers, those at the
10th percentile, increased only slightly more, by 4%, from $10.71 in 1979
to $11.12 in 2018.
The report admits that the
state’s progressive economy is delivering more to investors and less to
wage-earners. “Since 2001, the share of state private-sector [annual new
income] that has gone to worker compensation has fallen by 5.6 percentage
points — from 52.9% to 47.3%.”
In 2016, California’s Gross
Domestic Product was $2.6 trillion, so the 5.6 percent drop shifted $146
billion away from wages. That is roughly $3,625 per person in 2016.
The report notes that wages
finally exceeded 1979 levels around 2017, and it splits the credit between the
Democrats’ minimum-wage boosts and President Donald Trump’s go-go economy.
The 40 years of flat wages are
partly hidden by a wave of new products and services. They include almost-free
entertainment and information on the Internet, cheap imported coffee in
supermarkets, and reliable, low-pollution autos in garages.
But the impact of California’s
flat wages is made worse by California’s rising housing costs, the report says,
even though it also ignores the rent-spiking impact of the establishment’s
pro-immigration policies:
In just the last decade
alone, the increase in the typical household’s rent far outpaced the rise in
the typical full-time worker’s annual earnings, suggesting that working
families and individuals are finding it increasingly difficult to make ends
meet. In fact, the basic cost of living in many parts of the state is more
than many single individuals or families can expect to earn, even if all adults
are working full-time.
…
Specifically, inflation-adjusted
median household rent rose by 16% between 2006 and 2017, while
inflation-adjusted median annual earnings for individuals working at least 35
hours per week and 50 weeks per year rose by just 2%, according to a Budget
Center analysis of US Census Bureau, American Community Survey data.
Many workers are being paid
little more today than workers were in 1979 even as worker productivity has
risen. Fewer employees have access to retirement plans sponsored by their
employers, leaving individual workers on their own to stretch limited dollars
and resources to plan how they’ll spend their later years affording the high
cost of living and health care in California. And as union representation has
declined, most workers today cannot negotiate collectively for better working
conditions, higher pay, and benefits, such as retirement and health care, like
their parents and grandparents did. On top of all this, workers who take on
contingent and independent work (often referred to as “gig work”), which in
many cases appears to be motivated by the need to supplement their primary job
or fill gaps in their employment, are rarely granted the same rights and legal
protections as traditional employees.
The center’s report tries to
blame the four-decade stretch of flat wages on the declining clout of unions.
But unions’ decline was impacted by the bipartisan elites’ policy of
mass-migration and imposed diversity.
In
2018, Breitbart reported how Progressives for
Immigration Reform interviewed Blaine Taylor, a union carpenter, about the
economic impact of migration:
TAYLOR: If I hired a framer to do
a small addition [in 1988], his wage would have been $45 an hour. That was
the minimum for a framing contractor, a good carpenter. For a helper, it was
about $25 an hour, for a master who could run a complete job, it was about $45
an hour. That was the going wage for plumbers as well. His helpers typically
got $25 an hour.
…
Now, the average wage in Los
Angeles for construction workers is less than $11 an hour. They can’t go lower
than the minimum wage. And much of that, if they’re not being paid by the hour
at less than $11 an hour, they’re being paid per piece — per piece of plywood
that’s installed, per piece of drywall that’s installed. Now, the subcontractor
can circumvent paying them as an hourly wage and are now being paid by 1099,
which means that no taxes are being taken out. [Emphasis added]
Diversity
also damaged the unions by shredding California’s civic solidarity. In 2007,
the progressive Southern Poverty Law Center posted a report with the title
“Latino Gang Members in Southern California are Terrorizing and Killing
Blacks.” In the same year, an op-ed in the Los Angeles Times described another murder by Latino
gangs as “a manifestation of an increasingly common trend: Latino ethnic
cleansing of African Americans from multiracial neighborhoods.”
The center’s board members
include the executive director of the state’s SEIU union, a professor from the
Goldman School of Public Policy at the University of California, Berkeley, and
the research director at the “Program for Environmental and Regional Equity” at
the University of Southern California, Los Angeles.
Outside
California, President Donald Trump’s low-immigration policies are pressuring
employers to raise Americans’ wages in a hot economy. The Wall Street Journal reportedAugust 29:
Overall, median weekly earnings
rose 5% from the fourth quarter of 2017 to the same quarter in 2018, according
to the Bureau of Labor Statistics. For workers between the ages of 25 and 34,
that increase was 7.6%.
The New York Times laments that reduced immigration does force wages
upwards and also does force companies to buy labor-saving, wage-boosting
machinery. Instead, NYT prioritizes "ideas about America’s identity and
culture.” http://bit.ly/2Zp2u2J
NYT Admits Fewer Immigrants Means Higher Wages, More
Labor-Saving Machines
.
THE INVITED INVADING HORDES: IT’S ALL
ABOUT KEEPING WAGES DEPRESSED!
"In the decade following the
financial crisis of 2007-2008, the capitalist class has delivered powerful
blows to the social position of the working class. As a result, the working
class in the US, the world’s “richest country,” faces levels of economic
hardship not seen since the 1930s."
"Inequality has reached unprecedented
levels: the wealth of America’s three richest people now equals the net
worth of the poorest half of the US population."
No comments:
Post a Comment