completely repudiated its association with the reforms of the New Deal and
Great Society periods. Clinton gutted welfare programs to provide an ample
supply of cheap labor for the rich (WHICH NOW MEANS OPEN BORDERS
AND NO E-VERIFY!), including a growing layer of black capitalists, and
passed the 1994 Federal Crime Bill, with its notorious “three strikes” provision
that has helped create the largest prison population in the world.”
NY Post: ‘Profiles in Corruption’ Reveals How the ‘Biden Five’ Made Millions Off Joe Biden Connections

1:47
Five family members of former Vice President Joe Biden have scored “sweetheart deals” and “favorable access” thanks to their connection to the 2020 Democrat White House candidate, reveals the forthcoming investigative book Profiles in Corruption: Abuse of Power by America’s Progressive Elite by five-time New York Times bestselling author and Breitbart News senior contributor Peter Schweizer.
The New York Post reports:
The Biden family’s apparent self-enrichment involves no less than five family members: Joe’s son Hunter, son-in-law Howard, brothers James and Frank, and sister Valerie.When this subject came up in 2019, Biden declared, “I never talked with my son or my brother or anyone else — even distant family — about their business interests. Period.”As we will see, this is far from the case…Joe Biden’s younger brother, James, has been an integral part of the family political machine from the earliest days when he served as finance chair of Joe’s 1972 Senate campaign, and the two have remained quite close. After Joe joined the U.S. Senate, he would bring his brother James along on congressional delegation trips to places like Ireland, Rome and Africa.When Joe became vice president, James was a welcomed guest at the White House, securing invitations to such important functions as a state dinner in 2011 and the visit of Pope Francis in 2015. Sometimes, James’ White House visits dovetailed with his overseas business dealings, and his commercial opportunities flourished during his brother’s tenure as vice president.
Read the rest here.
Rich in US and UK live nearly ten more healthy years than the poor
Data has proven that the rich have a longer life expectancy than the poor in the US and UK. Now a new study shows that wealthy men and women generally have eight to nine more years of “disability free” life after age 50 than the poorest American and English adults.
The findings were published Wednesday in the Journals of Gerontology: Series A. Researchers sought answers to two main questions: What role do sociological factors play in how long people live healthy lives? And do English adults remain disability-free longer than American adults?
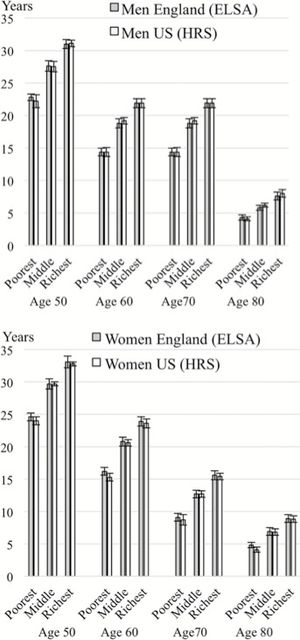 Disability-free life expectancy estimates according to social class and age, men and women in England and the United States (2002–2013). Credit: The Journals of Gerontology: Series A
Researchers from University College London, Harvard University and institutions in three other countries utilized two already existing data sets—one in the US, one in the UK—of more than 25,000 people over age 50. While life expectancy is a useful tool for measuring health, health experts increasingly recognize that the quality of life of later years is equally crucial.
The two sets of data on aging were from the Gateway to Global Aging Data, which included 14,803 men and women aged 50-plus from the US Health and Retirement Study (HRS), and the English Longitudinal Study of Ageing (ELSA), which including 10,754 English individuals aged 50-plus. HRS began in 1991; ELSA began in 2002/2003.
To maximize comparability of the two studies, other data was used from the Gateway to Global Aging Data from 2002/2003 to 2012/2013. Due to the makeup of the data sets, the findings apply only to individuals who identify as white, although the study authors estimate that the outcomes would be similar for non-white ethnicities as a sample that included these groups showed.
The new research divided individuals into three equal groups according to household wealth: poorest, middle and richest—household wealth was defined as the sum of net financial wealth and net housing wealth, less all debts.
They were also assigned one of three levels in the following categories:
* Educational attainment: (low) less than high school; (medium) high school graduate and some college; (high) college degree or more
* Occupational social class: (low) routine, manual, elementary occupations; (intermediate) administrative, secretarial, personal services, sales; (high) managers, professionals, technical
Health expectancy, or quality of life, was measured according to the presence of disability. These disabilities include difficulty in performing daily personal care, preparing a hot meal, shopping for groceries, making phone calls, taking medications, managing money, and other routine tasks.
Research showed that the absolute difference in disability life expectancy—healthy living vs. poor quality of life—was largest for wealth in England and for wealth and education in the United States. In other words, in both countries the most economically advantaged groups could expect to live longer without disability than the most disadvantaged groups (see graphs).
The delivery of health care is different in the United States and England. In England, healthcare is publicly funded through the UK’s National Health Service (NHS), although there have been deep attacks on the health system through privatization. Service through the NHS has been plagued by budget cuts, understaffing and privatization. There have been numerous cases of patients dying while waiting for emergency care.
According to NHS England, the health service recently missed all targets for Accident and Emergency (A&E) care, operations and cancer treatment. Cuts, underfunding and understaffing are reaping a terrible human cost, with many needlessly dying or suffering life-threatening diseases and illnesses that could have been contained if acted upon earlier. The Conservative government of prime minister Boris Johnson threatens even bigger attacks on the NHS, with the ultimate aim of complete privatization. Labour has done nothing to fight this assault.
In the US, health coverage is provided through private health insurance for many working-age adults and their families, and through publicly funded health care for the poor (Medicaid) and for those 65 and older and the disabled (Medicare). Currently an estimated 13.7 percent of the US population is uninsured.
The Affordable Care Act, signed into law by Democratic President Obama in 2010, lowered the uninsured rate somewhat. However, the legislation known as Obamacare was not a public program. It required individuals without insurance to purchase health coverage from private insurers under threat of a tax penalty.
Those buying in were subject to skyrocketing premiums and deductibles. Under the Trump administration, the uninsured rate has begun to rise. It is now clear that Obamacare was part of a deliberate drive by the ruling class to lower the life expectancy of working people.
The “Medicare for All” plans advanced by Democratic presidential candidates Elizabeth Warren and Bernie Sanders are not the solution to this healthcare and quality of life crisis. They constitute a fraud which the two senators know will never be implemented because the private insurance companies and pharmaceutical industry will not allow their own expropriation.
The bottom line is that despite the differences between the US and UK in health care delivery, it is the working class that is subject to inadequate medical care. In many cases this care is either substandard and of poor quality or nonexistent altogether. On the other hand, the rich in both countries are able obtain the finest-quality private medical care that money can buy.
This stark disparity is shown in the current study findings. At the age of 50, men and women in the lowest social class group compared to those in the highest group could expect to live five fewer years free from disability in both the US and England. These disparities between rich and poor lead not only to added years of disability and suffering, but to premature deaths.
Overall life expectancy in the US fell from 2014 to 2017, a streak unprecedented among advanced economies in the modern era. US life expectancy peaked in 2014 at 78.9 years; by 2017, life expectancy had fallen to 78.6 years. In the UK, life expectancy has leveled off during this same period, and stands at about 80.9 years. The drop in life expectancy in the US and the stagnation in the UK are indicative of societies in deep distress.
High-quality, free medical care is a fundamental social right, but genuinely socialized medicine does not currently exist in any country on the planet. The fight for socialized medicine stands at the center of a socialist program, which must be fought for by the international working class armed with an internationalist and socialist perspective.
OBAMAnomics:
Billionaire
Class Enjoys 15X the Wage Growth of American Working Class
The
billionaire class — the country’s top 0.01 percent of earners — have enjoyed
more than 15 times as much wage growth as America’s working and middle class
since 1979, new wage data reveals.
Study: Elite Zip Codes
Thrived in Obama Recovery, Rural America Left Behind
Wealthy
cities and elite zip codes thrived under the slow-moving economic recovery of
President Obama while rural American communities were left behind, a study
reveals.
Record
high income in 2017 for top one percent of wage earners in US
Graph from the Economic
Policy Institute
THE STAGGERING ECONOMIC INEQUALITY UNDER OBAMA'S ADMINISTRATION SERVING THE BILLIONAIRE CLASS.
OBAMA: SERVANT OF THE 1%
Richest one percent controls nearly half of global wealth
Millionaires projected to own 46
percent of global private wealth by 2019
Millionaires projected to own 46 percent of global private
wealth by 2019
By Gabriel Black
Millionaires
projected to own 46 percent of global private wealth by 2019
By
Gabriel Black
"During the month, some 432,000 people in the US gave up looking for a job." EVEN AS JEB BUSH, HILLARY CLINTON and BERNIE SANDERS PREACH AMNESTY! AMNESTY! AMNESTY!
"The American phenomenon of record stock values fueling an ever greater concentration of wealth at the very top of society, while the economy is starved of productive investment, the social infrastructure crumbles, and working class living standards are driven down by entrenched unemployment, wage-cutting and government austerity policies, is part of a broader global process."
HILLARY CLINTON'S BIGGEST DONORS ARE OBAMA'S CRIMINAL CRONY
BANKSTERS!
"A defining expression of this crisis is the dominance of financial speculation and parasitism, to the point where a narrow international financial aristocracy plunders society’s resources in order to further enrich itself."
Federal Reserve documents stagnant state of US economy
Federal Reserve documents stagnant state of US economy
By Barry Grey
Lessons
of the fight against Obama’s “school reform”—Part 1
By Nancy Hanover and Jerry White
Workers
from throughout state joined in protesting Walker's cuts
Lessons of Wisconsin
Protesters
occupy the Wisconsin Capitol in Madison. Credit: Joe Rowley
OBAMAnomics:
Billionaire
Class Enjoys 15X the Wage Growth of American Working Class
The
billionaire class — the country’s top 0.01 percent of earners — have enjoyed
more than 15 times as much wage growth as America’s working and middle class
since 1979, new wage data reveals.
Between 1979 and 2017, the wages of the bottom 90 percent — the
country’s working and lower middle class — have grown by only about 22 percent,
Economic Policy Institute (EPI) researchers find.
Compare that small wage
increase over nearly four decades to the booming wage growth of America’s top
one percent, who have seen their wages grow more than 155 percent during the
same period.
The top 0.01 percent — the
country’s billionaire class — saw their wages grow by more than 343
percent in the last four decades, more than 15 times the wage growth of the
bottom 90 percent of Americans.
In 1979, America’s working
class was earning on average about $29,600 a year. Fast forward to 2017, and the
same bottom 90 percent of Americans are earning only about $6,600 more
annually.
The almost four decades of wage
stagnation among the country’s working and middle class comes as the national
immigration policy has allowed for the admission of more than 1.5 million
mostly low-skilled immigrants every year.
(Public Citizen)
In the last decade, alone, the U.S. admitted ten million legal
immigrants, forcing American workers to compete against a growing population of
low-wage workers. Meanwhile, employers are able to reduce wages and drive up
their profit margins thanks to the annual low-skilled immigration scheme.
The Washington, DC-imposed mass immigration policy
is a boon to corporate executives, Wall Street, big business, and multinational
conglomerates as every one percent increase in the immigrant composition of an
occupation’s labor force reduces Americans’ hourly wages
by 0.4 percent. Every one percent increase in the immigrant workforce reduces
Americans’ overall wages by 0.8 percent.
Mass immigration has come at
the expense of America’s working and middle class, which has suffered from poor
job growth, stagnant wages, and increased public costs to offset the
importation of millions of low-skilled foreign nationals.
Four million young Americans enter the workforce every year, but
their job opportunities are further diminished as the U.S. imports roughly two
new foreign workers for every four American workers who enter the workforce.
Even though researchers say 30 percent of the workforce could lose their jobs due to
automation by 2030, the U.S. has not stopped importing more than a million
foreign nationals every year.
For blue-collar American workers, mass immigration has not only
kept wages down but in many cases decreased wages, as Breitbart News reported. Meanwhile, the U.S. continues
importing more foreign nationals with whom working-class Americans are
forced to compete. In 2016, the U.S. brought in about 1.8 million
mostly low-skilled immigrants.
Study: Elite Zip Codes
Thrived in Obama Recovery, Rural America Left Behind
4:49
Wealthy
cities and elite zip codes thrived under the slow-moving economic recovery of
President Obama while rural American communities were left behind, a study
reveals.
The Economic Innovation Group research, highlighted by Axios, details the massive
economic inequality between the country’s coastal city elites and middle America’s
working class between the Great Recession in 2007 and Obama’s economic recovery
in 2016.
Between 2007 and 2016, the
number of residents living in elite zip codes grew by more than ten million,
with an overwhelming faction of that population growth being driven by mass
immigration where the U.S. imports more than 1.5 million illegal and legal
immigrants annually.
The booming 44.5 million immigrant populations are concentrated mostly in the country’s
major cities like Los Angeles, California, Miami Florida, and New York City,
New York. The rapidly growing U.S. population — driven by immigration — is set
to hit 404 millionby 2060, a boon for real estate
developers, wealthy investors, and corporations, all of which benefit greatly
from dense populations and a flooded labor market.
The economic study found that
while the population grew in wealthy cities, America’s rural population fell by
nearly 3.5 million residents.
Likewise, by 2016, elite zip
codes had a surplus of 3.6 million jobs, which is more than the combined bottom
80 percent of American zip codes. While it only took about five years for
wealthy cities to replace the jobs lost by the recession, it took “at risk”
regions of the country a decade to recover, and “distressed” U.S. communities
are “unlikely ever to recover on current trendlines,” the report predicts.
A map included in the research
shows how rich, coastal metropolises have boomed economically while entire
portions of middle America have been left behind as job and business gains
remain concentrated at the top of the income ladder.
(Economic Innovation
Group)
(Economic Innovation Group)
Economic growth among the
country’s middle-class counties and middle-class zip codes has considerably
trailed national economic growth, the study found.
For example, between 2012 and
2016, there were 4.4 percent more business establishments in the country as a
whole. That growth was less than two percent in the median zip code and there
was close to no growth in the median county.
The same can be said of employment
growth, where U.S. employment grew by about 9.3 percent from 2012 to 2016. In
the median zip code, though, employment grew by only 5.5 percent and in the
median county, employment grew by less than four percent.
“Nearly three in every five
large counties added businesses on net over the period, compared to only one in
every five small one,” the report concluded.
Elite zip codes added more
business establishments during Obama’s economic recovery, between 2012 and
2016, than the entire bottom 80 percent of zip codes combined. For instance,
while more than 180,000 businesses have been added to rich zip codes, the
country’s bottom tier has lost more than 13,000 businesses even after the
economic recovery.
(Economic Innovation
Group)
(Economic Innovation Group)
The gutting of the American manufacturing base, through free
trade, has been a driving catalyst for the collapse of the
white working class and black Americans. Simultaneously, the outsourcing of the
economy has brought major wealth to corporations, tech conglomerates, and Wall
Street.
The dramatic decline of U.S. manufacturing at the hands of free
trade—where more than 3.4 million American jobs have been
lost solely due to free trade with China, not including the American jobs lost
due to agreements like the North American Free Trade Agreement (NAFTA) and the
United States-Korea Free Trade Agreement (KORUS)—has coincided with growing
wage inequality for white and black Americans, a growing number of single mother
households, a drop in U.S. marriage rates, a general stagnation of
working and middle class wages, and specifically, increased black American
unemployment.
“So, the loss of manufacturing
work since 1960 represents a steady decline in relatively high-paying jobs for
less-educated workers,” recent research from economist Eric D. Gould has
noted.
Fast-forward to the modern economy and the wage trend has been
the opposite of what it was during the peak of manufacturing in the U.S. An
Economic Policy Institute studyfound this year that been 2009 and 2015, the top one
percent of American families earned about 26 times as much income as the
bottom 99 percent of Americans.
Record
high income in 2017 for top one percent of wage earners in US
In 2017, the top one percent of US wage earners received
their highest paychecks ever, according to a report by the Economic Policy
Institute (EPI).
Based on newly released data from the Social Security
Administration, the EPI shows that the top one percent of the population saw
their paychecks increase by 3.7 percent in 2017—a rate nearly quadruple the
bottom 90 percent of the population. The growth was driven by the top 0.1
percent, which includes many CEOs and corporate executives, whose pay increased
eight percent and averaged $2,757,000 last year.
The EPI report is only the latest exposure of the gaping
inequality between the vast majority of the population and the modern-day
aristocracy that rules over them.
The EPI shows that the bottom 90 percent of wage earners
have increased their pay by 22.2 percent between 1979 and 2017. Today, this
bottom 90 percent makes an average of just $36,182 a year, which is eaten up by
the cost of housing and the growing burden of education, health care, and
retirement.
Meanwhile, the top one percent has increased its wages by
157 percent during this same period, a rate seven times faster than the other
group. This top segment makes an average of $718,766 a year. Those in-between,
the 90th to 99th percentile, have increased their wages by 57.4 percent. They
now make an average of $152,476 a year—more than four times the bottom 90
percent.
Decades of decaying capitalism have led to this
accelerating divide. While the rich accumulate wealth with no restriction,
workers’ wages and benefits have been under increasing attack. In 1979, 90
percent of the population took in 70 percent of the nation’s income. But, by
2017, that fell to only 61 percent.
Even more, while the bottom 90 percent of the population
may take in 61 percent of the wages, large sections of the workforce today
barely pull in any income at all. For example, Social Security
Administration data found that the bottom 54 percent of wage earners in the
United States, 89.5 million people, make an average of just $15,100 a year.
This 54 percent of the population earns only 17 percent of all wages paid in
America.
However unequal, these wage inequalities still do not fully
present the divide between rich and poor. The ultra-wealthy derive their wealth
not primarily from wages, but from assets and equities—principally from the
stock market. While the bottom 90 percent of the population made 61 percent of
the wages in 2017, they owned even less, just 27 percent of the wealth
(according to the World Inequality Report 2018 by Thomas
Piketty, Emmanuel Saez, and Gabriel Zucman).
The massive increase in the value of the stock market,
which only a small segment of the population participates in, means that the
top 10 percent of the population controls 73 percent of all wealth in the
United States. Just three men—Jeff Bezos, Warren Buffet and Bill Gates—had more
wealth than the bottom half of America combined last year.
Wages are so low in the United States that roughly half of
the population falls deeper into debt every year. A Reuters report from July
found that the pretax net income (that is, income minus expense) of the bottom
40 percent of the population was an average of negative $11,660.
Even the middle quintile of the population, the 40th to 60th percentile, breaks
even with an average of only $2,836 a year.
As the Social Security Administration numbers show, 67.4
percent of the population made less than the average wage, $48,250 a year in
2017, a sum that is inadequate to support a family in many cities—especially,
with high housing costs, health care, education, and retirement factored in.
For the ruling class, though, workers’ wages are already
too much. The volatility of the stock market and the deep fear that the current
bull market will collapse has made politicians and businessmen anxious of any
sign of wage increases.
In August, wages in the US rose just 0.2 percent above the
inflation rate, the highest in nine years. Though the increase was tiny, it was
enough to encourage the Federal Reserve to increase the interest rate past two
percent for the first time since 2008. Raising interest rates helps to depress
workers’ wages by lowering borrowing and spending. As the Financial
Times noted, stopping wage growth was “central” to the Federal
Reserve’s move.
Further analysis of the Social Security Administration data
shows that in 2017, 147,754 people reported wages of 1 million dollars or
more—roughly, the top 0.05 percent. Their combined total income of $372 billion
could pay for the US federal education budget five times over.
These wages, however large, still pale in comparison to the
money the ultra-rich acquire from the stock market. For example, share buybacks
and dividend payments, a way of funneling money to shareholders, will eclipse
$1 trillion this year.
Whatever the immediate source, the wealth of the rich
derives from the great mass of people who do the actual work. Across the United
States and around the world, workers, young people, and students have entered
into struggle this year over pay, education, health care, immigration, war and
democratic rights. This growing movement of the working class must set as its
aim confiscating the wealth and power of this tiny parasitic oligarchy.
Society’s wealth must be democratically controlled by those who produce it.
THE STAGGERING ECONOMIC INEQUALITY UNDER OBAMA'S ADMINISTRATION SERVING THE BILLIONAIRE CLASS.
THE ENTIRE REASON BEHIND AMNESTY IS TO KEEP WAGES
DEPRESSED AND PASS ALONG THE REAL COST OF "CHEAP" MEXICAN LABOR TO
THE AMERICAN MIDDLE CLASS.
AND IT'S WORKING!
SEN.
BERNIE SANDERS
“Calling
income and wealth inequality the "great moral issue of our time,"
Sanders laid out a sweeping, almost unimaginably expensive program to transfer
wealth from the richest Americans to the poor and middle class. A $1 trillion
public works program to create "13 million good-paying jobs." A $15-an-hour
federal minimum wage. "Pay equity" for women. Paid sick leave and
vacation for everyone. Higher taxes on the wealthy. Free tuition at all public
colleges and universities. A Medicare-for-all single-payer health care system.
Expanded Social Security benefits. Universal pre-K.” WASHINGTON
EXAMINER
YOU
THOUGHT OBAMA INVITED OBAMANOMICS and started the assault on the American
middle-class?
NOPE!
“By the time of Bill
Clinton’s election in 1992, the Democratic Party had completely repudiated its
association with the reforms of the New Deal and Great Society periods. Clinton
gutted welfare programs to provide an ample supply of cheap labor for the rich
(WHICH NOW MEANS OPEN BORDERS AND NO E-VERIFY!), including a growing layer of
black capitalists, and passed the 1994 Federal Crime Bill, with its notorious
“three strikes” provision that has helped create the largest prison population
in the world.”
Clinton Foundation Put On Watch List Of Suspicious
‘Charities’
OBAMA: SERVANT OF THE 1%
Richest one percent controls nearly half of global wealth
The
richest one percent of the world’s population now controls 48.2 percent of
global wealth, up from 46 percent last year.
The report found that the
growth of global inequality has accelerated sharply since the 2008 financial
crisis, as the values of financial assets have soared while wages have
stagnated and declined.
Millionaires projected to own 46
percent of global private wealth by 2019
Households with more than a million (US) dollars in private wealth are
projected to own 46 percent of global private wealth in 2019 according to a new
report by the Boston Consulting Group (BCG).
This large percentage, however, only includes cash, savings, money market
funds and listed securities held through managed investments—collectively known
as “private wealth.” It leaves out businesses, residences and luxury goods,
which comprise a substantial portion of the rich’s net worth.
At the end of 2014, millionaire households owned about 41
percent of global private wealth, according to BCG. This means that
collectively these 17 million households owned roughly $67.24 trillion in
liquid assets, or about $4 million per household.
In total, the world added $17.5 trillion of new private wealth between
2013 and 2014. The report notes that nearly three quarters of all these gains
came from previously existing wealth. In other words, the vast majority of
money gained has been due to pre-existing assets increasing in value—not the
creation of new material things.
This trend is the result of the massive infusions of cheap credit into
the financial markets by central banks. The policy of “quantitative easing” has
led to a dramatic expansion of the stock market even while global economic
growth has slumped.
While the wealth of the rich is growing at a breakneck
pace, there is a stratification of growth within the super wealthy, skewed
towards the very top.
In 2014, those with over $100 million in private wealth saw their wealth
increase 11 percent in one year alone. Collectively, these households owned $10
trillion in 2014, 6 percent of the world’s private wealth. According to the
report, “This top segment is expected to be the fastest growing, in both the
number of households and total wealth.” They are expected to see 12 percent
compound growth on their wealth in the next five years.
Those families with wealth between $20 and $100 million also rose
substantially in 2014—seeing a 34 percent increase in their wealth in twelve
short months. They now own $9 trillion. In five years they will surpass $14
trillion according to the report.
Coming in last in the “high net worth” population are those with between
$1 million and $20 million in private wealth. These households are expected to
see their wealth grow by 7.2 percent each year, going from $49 trillion to
$70.1 trillion dollars, several percentage points below the highest bracket’s
12 percent growth rate.
The gains in private wealth of the ultra-rich stand in sharp contrast to
the experience of billions of people around the globe. While wealth
accumulation has sharply sped up for the ultra-wealthy, the vast majority of
people have not even begun to recover from the past recession.
An Oxfam report from January, for example,
shows that the bottom 99 percent of the world’s population went from having
about 56 percent of the world’s wealth in 2010 to having 52 percent of it in
2014. Meanwhile the top 1 percent saw its wealth rise from 44 to 48 percent of
the world’s wealth.
In 2014 the Russell Sage Foundation found that between 2003 and 2013, the
median household net worth of those in the United States fell from $87,992 to
$56,335—a drop of 36 percent. While the rich also saw their wealth drop during
the recession, they are more than making that money back. Between 2009 and
2012, 95 percent of all the income gains in the US went to the top 1 percent.
This is the most distorted post-recession income gain on record.
As the Organization for Economic Co-operation and Development (OECD) has
noted, in the United States “between 2007 and 2013, net wealth fell on average
2.3 percent, but it fell ten-times more (26 percent) for those at the bottom 20
percent of the distribution.” The 2015 report concludes that “low-income
households have not benefited at all from income growth.”
Another report by Knight Frank, looks at those with wealth
exceeding $30 million. The report notes that in 2014 these 172,850
ultra-high-net-worth individuals increased their collective wealth by $700
billion. Their total wealth now rests at $20.8 trillion.
The report also draws attention to the disconnection between the rich and
the actual economy. It states that the growth of this ultra-wealthy population
“came despite weaker-than-anticipated global economic growth. During 2014 the
IMF was forced to downgrade its forecast increase for world output from 3.7
percent to 3.3 percent.”
DICK
MORRIS:
On America’s First
Family of Crime….. NO! Not the Bushes again!
Clinton global
hucksterism – Selling out America like they sold out the Lincoln Bedroom.
HILLARY CLINTON: CRONY
CLASS’ “Hope and Change” huckster’s successor!
“I serve Obama’s cronies
first, illegals second and together we will loot the American middle-class to
double our figures. It’s called BAILOUTS! Evita Peron Clinton
At this point, Clinton is the choice of most multimillionaires
to be the next occupant of the White House. A recent CNBC poll of 750
millionaires found 53 percent support for Clinton in a contest with Republican
Jeb Bush, 14 points better than Obama’s showing in the 2012 election with the
same group.
Sen. Bernie Sanders –
America’s answer to Wall Street’s looting, the war on the American middle-class
and jobs for legals!
“At
this point, Clinton is the choice of most multimillionaires to be the next
occupant of the White House. A recent CNBC poll of 750 millionaires found 53
percent support for Clinton in a contest with Republican Jeb Bush, 14 points
better than Obama’s showing in the 2012 election with the same group.”
THE CRONY CLASS:
OBAMACLINTONOMICS was created by BILLARY
CLINTON!
Income inequality grows FOUR TIMES FASTER under Obama than
Bush.
“By the time of Bill
Clinton’s election in 1992, the Democratic Party had completely repudiated its
association with the reforms of the New Deal and Great Society periods. Clinton
gutted welfare programs to provide an ample supply of cheap labor for the rich
(WHICH NOW MEANS OPEN BORDERS AND NO E-VERIFY!), including a growing layer of
black capitalists, and passed the 1994 Federal Crime Bill, with its notorious
“three strikes” provision that has helped create the largest prison population
in the world.”
“Calling
income and wealth inequality the "great moral issue of our time,"
Sanders laid out a sweeping, almost unimaginably expensive program to transfer
wealth from the richest Americans to the poor and middle class. A $1 trillion
public works program to create "13 million good-paying jobs." A
$15-an-hour federal minimum wage. "Pay equity" for women. Paid sick
leave and vacation for everyone. Higher taxes on the wealthy. Free tuition at
all public colleges and universities. A Medicare-for-all single-payer health
care system. Expanded Social Security benefits. Universal pre-K.” WASHINGTON
EXAMINER
OBAMA’S
WALL STREET and the LOOTING of AMERICA – SECOND TERM
The corporate cash hoard has likewise reached
a new record, hitting an estimated $1.79 trillion in the fourth quarter of last
year, up from $1.77 trillion in the previous quarter. Instead of investing the
money, however, companies are using it to buy back their own stock and pay out
record dividends.
Megan
McArdle Discusses How America's Elites Are Rigging the Rules - Newsweek/The
Daily Beast special correspondent Megan McArdle joins Scott Rasmussen for a
discussion on America's new Mandarin class.
PATRICK BUCHANAN: OBAMA’S ASSAULT ON
AMERICA BEGINS AT OUR BORDERS
WHO REALLY PAYS FOR THE CRIMES OF OBAMA’S
CRONY DONORS???
LAST WEEK BARACK OBAMA CELEBRATED FIVE YEARS OF THE LOOTING BY
HIS WALL STREET BANKSTERS… now it’s back to cutting social programs to pay for
all that rape by the 1% he represents. The following week it will be back to
the AMNESTY HOAX to legalize Mexico’s looting of America and make it legal that
Mexicans get our jobs first… they already do!
As in previous budget crises under the Obama administration, the
events are being stage-managed by the two corporate-controlled parties to give
the illusion of partisan gridlock and confrontation over principles—in this
case, whether to go forward with the implementation of the Obama health care
program—while behind the scenes all factions within the ruling elite agree that
massive cuts must be carried through in basic federal social programs.
OBAMA’S CRONY CAPITALISM – A NATION RULED BY
CRIMINAL WALL STREET BANKSTERS AND OBAMA DONORS
GET
THIS BOOK
Culture of Corruption: Obama and His Team of
Tax Cheats, Crooks, and Cronies
by Michelle Malkin
In her shocking new book, Malkin digs deep into the records
of President Obama's staff, revealing corrupt dealings, questionable pasts, and
abuses of power throughout his administration.
PATRICK BUCHANAN
After Obama has completely destroyed the
American economy, handed millions of jobs to illegals and billions of dollars
in welfare to illegals…. BUT WHAT COMES NEXT?
OBAMANOMICS:
IS IT WORKING???
Millionaires projected to own 46 percent of global private
wealth by 2019
By Gabriel Black
18 June 2015
Households
with more than a million (US) dollars in private wealth are projected to own 46
percent of global private wealth in 2019 according to a new report by the Boston
Consulting Group (BCG).
This
large percentage, however, only includes cash, savings, money market funds and
listed securities held through managed investments—collectively known as
“private wealth.” It leaves out businesses, residences and luxury goods, which
comprise a substantial portion of the rich’s net worth.
At
the end of 2014, millionaire households owned about 41 percent of global
private wealth, according to BCG. This means that collectively these 17 million
households owned roughly $67.24 trillion in liquid assets, or about $4 million
per household.
In
total, the world added $17.5 trillion of new private wealth between 2013 and
2014. The report notes that nearly three quarters of all these gains came from
previously existing wealth. In other words, the vast majority of money gained
has been due to pre-existing assets increasing in value—not the creation of new
material things.
This
trend is the result of the massive infusions of cheap credit into the financial
markets by central banks. The policy of “quantitative easing” has led to a
dramatic expansion of the stock market even while global economic growth has
slumped.
While
the wealth of the rich is growing at a breakneck pace, there is a
stratification of growth within the super wealthy, skewed towards the very top.
In
2014, those with over $100 million in private wealth saw their wealth increase
11 percent in one year alone. Collectively, these households owned $10 trillion
in 2014, 6 percent of the world’s private wealth. According to the report,
“This top segment is expected to be the fastest growing, in both the number of
households and total wealth.” They are expected to see 12 percent compound
growth on their wealth in the next five years.
Those
families with wealth between $20 and $100 million also rose substantially in
2014—seeing a 34 percent increase in their wealth in twelve short months. They
now own $9 trillion. In five years they will surpass $14 trillion according to
the report.
Coming
in last in the “high net worth” population are those with between $1 million
and $20 million in private wealth. These households are expected to see their
wealth grow by 7.2 percent each year, going from $49 trillion to $70.1 trillion
dollars, several percentage points below the highest bracket’s 12 percent
growth rate.
The
gains in private wealth of the ultra-rich stand in sharp contrast to the
experience of billions of people around the globe. While wealth accumulation
has sharply sped up for the ultra-wealthy, the vast majority of people have not
even begun to recover from the past recession.
An
Oxfam report from
January, for example, shows that the bottom 99 percent of the world’s
population went from having about 56 percent of the world’s wealth in 2010 to
having 52 percent of it in 2014. Meanwhile the top 1 percent saw its wealth
rise from 44 to 48 percent of the world’s wealth.
In
2014 the Russell Sage Foundation found that between 2003 and 2013, the median
household net worth of those in the United States fell from $87,992 to
$56,335—a drop of 36 percent. While the rich also saw their wealth drop during
the recession, they are more than making that money back. Between 2009 and
2012, 95 percent of all the income gains in the US went to the top 1 percent.
This is the most distorted post-recession income gain on record.
As
the Organization for Economic Co-operation and Development (OECD) has noted, in
the United States “between 2007 and 2013, net wealth fell on average 2.3
percent, but it fell ten-times more (26 percent) for those at the bottom 20
percent of the distribution.” The 2015 report concludes that “low-income
households have not benefited at all from income growth.”
Another
report by Knight Frank, looks at those with wealth exceeding $30
million. The report notes that in 2014 these 172,850 ultra-high-net-worth
individuals increased their collective wealth by $700 billion. Their total
wealth now rests at $20.8 trillion.
The
report also draws attention to the disconnection between the rich and the
actual economy. It states that the growth of this ultra-wealthy population
“came despite weaker-than-anticipated global economic growth. During 2014 the
IMF was forced to downgrade its forecast increase for world output from 3.7
percent to 3.3 percent.”
THE CRONY
CLASS:
OBAMACLINTONOMICS was created by BILLARY
CLINTON!
Income inequality grows FOUR TIMES FASTER under Obama than
Bush.
“By the time of Bill Clinton’s election in
1992, the Democratic Party had completely repudiated its association with the
reforms of the New Deal and Great Society periods. Clinton gutted welfare
programs to provide an ample supply of cheap labor for the rich (WHICH NOW
MEANS OPEN BORDERS AND NO E-VERIFY!), including a growing layer of black
capitalists, and passed the 1994 Federal Crime Bill, with its notorious “three
strikes” provision that has helped create the largest prison population in the
world.”
*
“Calling
income and wealth inequality the "great moral issue of our time,"
Sanders laid out a sweeping, almost unimaginably expensive program to transfer
wealth from the richest Americans to the poor and middle class. A $1 trillion
public works program to create "13 million good-paying jobs." A $15-an-hour
federal minimum wage. "Pay equity" for women. Paid sick leave and
vacation for everyone. Higher taxes on the wealthy. Free tuition at all public
colleges and universities. A Medicare-for-all single-payer health care system.
Expanded Social Security benefits. Universal pre-K.” WASHINGTON
EXAMINER
OBAMA’S
WALL STREET and the LOOTING of AMERICA – SECOND TERM
The corporate cash hoard has likewise reached
a new record, hitting an estimated $1.79 trillion in the fourth quarter of last
year, up from $1.77 trillion in the previous quarter. Instead of investing the
money, however, companies are using it to buy back their own stock and pay out
record dividends.
Megan
McArdle Discusses How America's Elites Are Rigging the Rules - Newsweek/The
Daily Beast special correspondent Megan McArdle joins Scott Rasmussen for a
discussion on America's new Mandarin class.
POLL: MOST
INCOMPETENT AND DISHONEST PRESIDENT SINCE…. Well, isn’t Obama merely Bush’s
THIRD and FOURTH TERMS??
OBAMA’S
CRONY CAPITALISM
A NATION
RULED BY CRIMINAL WALL STREET BANKSTERS AND OBAMA DONORS
PATRICK
BUCHANAN
After Obama
has completely destroyed the American economy, handed millions of jobs to
illegals and billions of dollars in welfare to illegals…. BUT WHAT COMES NEXT?
OBAMANOMICS: IS IT WORKING???
Millionaires
projected to own 46 percent of global private wealth by 2019
By
Gabriel Black
18 June 2015
Households with more than a million (US)
dollars in private wealth are projected to own 46 percent of global private
wealth in 2019 according to a new report by the Boston Consulting
Group (BCG).
This large percentage, however, only
includes cash, savings, money market funds and listed securities held through
managed investments—collectively known as “private wealth.” It leaves out
businesses, residences and luxury goods, which comprise a substantial portion
of the rich’s net worth.
At the end of 2014, millionaire households
owned about 41 percent of global private wealth, according to BCG. This means
that collectively these 17 million households owned roughly $67.24 trillion in
liquid assets, or about $4 million per household.
In total, the world added $17.5 trillion
of new private wealth between 2013 and 2014. The report notes that nearly three
quarters of all these gains came from previously existing wealth. In other
words, the vast majority of money gained has been due to pre-existing assets
increasing in value—not the creation of new material things.
This trend is the result of the massive
infusions of cheap credit into the financial markets by central banks. The
policy of “quantitative easing” has led to a dramatic expansion of the stock
market even while global economic growth has slumped.
While the wealth of the rich is growing at
a breakneck pace, there is a stratification of growth within the super wealthy,
skewed towards the very top.
In 2014, those with over $100 million in
private wealth saw their wealth increase 11 percent in one year alone.
Collectively, these households owned $10 trillion in 2014, 6 percent of the
world’s private wealth. According to the report, “This top segment is expected
to be the fastest growing, in both the number of households and total wealth.”
They are expected to see 12 percent compound growth on their wealth in the next
five years.
Those families with wealth between $20 and
$100 million also rose substantially in 2014—seeing a 34 percent increase in
their wealth in twelve short months. They now own $9 trillion. In five years
they will surpass $14 trillion according to the report.
Coming in last in the “high net worth”
population are those with between $1 million and $20 million in private wealth.
These households are expected to see their wealth grow by 7.2 percent each
year, going from $49 trillion to $70.1 trillion dollars, several percentage
points below the highest bracket’s 12 percent growth rate.
The gains in private wealth of the
ultra-rich stand in sharp contrast to the experience of billions of people
around the globe. While wealth accumulation has sharply sped up for the ultra-wealthy,
the vast majority of people have not even begun to recover from the past
recession.
An Oxfam report from January,
for example, shows that the bottom 99 percent of the world’s population went
from having about 56 percent of the world’s wealth in 2010 to having 52 percent
of it in 2014. Meanwhile the top 1 percent saw its wealth rise from 44 to 48
percent of the world’s wealth.
In 2014 the Russell Sage Foundation found
that between 2003 and 2013, the median household net worth of those in the
United States fell from $87,992 to $56,335—a drop of 36 percent. While the rich
also saw their wealth drop during the recession, they are more than making that
money back. Between 2009 and 2012, 95 percent of all the income gains in the US
went to the top 1 percent. This is the most distorted post-recession income
gain on record.
As the Organization for Economic
Co-operation and Development (OECD) has noted, in the United States “between
2007 and 2013, net wealth fell on average 2.3 percent, but it fell ten-times
more (26 percent) for those at the bottom 20 percent of the distribution.” The
2015 report concludes that “low-income households have not benefited at all
from income growth.”
Another report by Knight Frank,
looks at those with wealth exceeding $30 million. The report notes that in 2014
these 172,850 ultra-high-net-worth individuals increased their collective
wealth by $700 billion. Their total wealth now rests at $20.8 trillion.
The report also draws attention to the
disconnection between the rich and the actual economy. It states that the
growth of this ultra-wealthy population “came despite weaker-than-anticipated
global economic growth. During 2014 the IMF was forced to downgrade its
forecast increase for world output from 3.7 percent to 3.3 percent.”
OBAMA-CLINTONomics:
the never end war on the American middle-class. But we still get the tax bills
for the looting of their Wall Street cronies and their bailouts and billions
for Mexico’s welfare state in our borders.
While
the wealth of the rich is growing at a breakneck pace, there is a
stratification of growth within the super wealthy, skewed towards the very top.
In 2014, those with over $100 million in
private wealth saw their wealth increase 11 percent in one year alone.
Collectively, these households owned $10 trillion in 2014, 6 percent of the
world’s private wealth. According to the report, “This top segment is expected
to be the fastest growing, in both the number of households and total wealth.”
They are expected to see 12 percent compound growth on their wealth in the next
five years.
In 2014
the Russell Sage Foundation found that between
2003 and
2013, the median household net worth of those in
the United
States fell from $87,992 to $56,335—a drop of 36
percent.
While the rich also saw their wealth drop during the
recession,
they are more than making that money back.
Between
2009 and 2012, 95 percent of all the income gains in
the US
went to the top 1 percent. This is the most distorted
post-recession
income gain on record.
INCOME
PLUMMETS UNDER OBAMA AND HIS WALL STREET CRONIES
collapse of household income in the US… STILL
BILLIONS IN WELFARE HANDED TO ILLEGALS… they already get our jobs and are
voting for more!
INCOME PLUMMETS UNDER OBAMA… most jobs go to
illegals.
AS HIS CRONY BANKSTERS CONTINUE TO LOOT, INCOMES PLUMMET FOR
AMERICANS (LEGALS).
GOOD TIME FOR AMNESTY FOR MILLIONS OF LOOTING MEXICANS?
MORE HERE:
http://mexicanoccupation.blogspot.com/2014/09/and-still-democrat-party-wants-millions.html
“The yearly income of a typical US household dropped by a
massive 12 percent, or $6,400, in the six years between 2007 and 2013. This is
just one of the findings of the 2013 Federal Reserve Survey of Consumer
Finances released Thursday, which documents a sharp decline in working class
living standards and a further concentration of wealth in the hands of the rich
and the super-rich.”
"During the month, some 432,000 people in the US gave up looking for a job." EVEN AS JEB BUSH, HILLARY CLINTON and BERNIE SANDERS PREACH AMNESTY! AMNESTY! AMNESTY!
"The American phenomenon of record stock values fueling an ever greater concentration of wealth at the very top of society, while the economy is starved of productive investment, the social infrastructure crumbles, and working class living standards are driven down by entrenched unemployment, wage-cutting and government austerity policies, is part of a broader global process."
HILLARY CLINTON'S BIGGEST DONORS ARE OBAMA'S CRIMINAL CRONY
BANKSTERS!
"A defining expression of this crisis is the dominance of financial speculation and parasitism, to the point where a narrow international financial aristocracy plunders society’s resources in order to further enrich itself."
Federal Reserve documents stagnant state of US economy
Federal Reserve documents stagnant state of US economy
By Barry Grey
21 July 2015
The US Federal Reserve
Board last week released its semiannual Monetary Policy Report to Congress,
providing an assessment of the state of the American economy and outlining the
central bank’s monetary policy going forward. The report, along with Fed Chair
Janet Yellen’s testimony before both the House of Representatives and the
Senate, as well as a speech by Yellen the previous week in Cleveland, present a
grim picture of the reality behind the official talk of economic “recovery.”
In her prepared remarks to Congress last Wednesday and Thursday, Yellen said, “Looking forward, prospects are favorable for further improvement in the US labor market and the economy more broadly.”
She reiterated her assurances that while the Fed would likely begin to raise its benchmark federal funds interest rate later this year from the 0.0 to 0.25 percent level it has maintained since shortly after the 2008 financial crash, it would do so only slowly and gradually, keeping short-term rates well below historically normal levels for an indefinite period.
This was an expected, but nevertheless welcome, signal to the American financial elite, which has enjoyed a spectacular rise in corporate profits, stock values and personal wealth since 2009 thanks to the flood of virtually free money provided by the Fed.
"But as Yellen’s remarks and the Fed report indicate, the explosion of asset values and wealth accumulation at the very top of the economic ladder has occurred alongside an intractable and continuing slump in the real economy."
In her prepared testimony to the House Financial Services Committee and the Senate Banking Committee, Yellen noted the following features of the performance of the US economy over the first six months of 2015:
* A sharp decline in the rate of economic growth as compared to 2014, including an actual contraction in the first quarter of the year.
* A substantial slackening (19 percent) in average monthly job-creation, from 260,000 last year to 210,000 thus far in 2015.
* Declines in domestic spending and industrial production.
In her July 10 speech to the City Club of Cleveland, Yellen cited an even longer list of negative indices, including:
* Growth in real gross domestic product (GDP) since the official beginning of the recovery in June, 2009 has averaged a mere 2.25 percent per year, a full one percentage point less than the average rate over the 25 years preceding what Yellen called the “Great Recession.”
* While manufacturing employment nationwide has increased by about 850,000 since the end of 2009, there are still almost 1.5 million fewer manufacturing jobs than just before the recession.
* Real GDP and industrial production both declined in the first quarter of this year. Industrial production continued to fall in April and May.
* Residential construction (despite extremely low mortgage rates by historical standards) has remained “quote soft.”
* Productivity growth has been “weak,” largely because “Business owners and managers… have not substantially increased their capital expenditures,” and “Businesses are holding large amounts of cash on their balance sheets.”
* Reflecting the general stagnation and even slump in the real economy, core inflation rose by only 1.2 percent over the past 12 months.
The Monetary Policy Report issued by the Fed includes facts that are, if anything, even more alarming, including:
* “Labor productivity in the business sector is reported to have declined in both the fourth quarter of 2014 and the first quarter of 2015.”
* “Exports fell markedly in the first quarter, held back by lackluster growth abroad.”
* “Overall construction activity remains well below its pre-recession levels.”
* “Since the recession began, the gains in… nominal compensation [workers’ wages and benefits] have fallen well short of their pre-recession averages, and growth of real compensation has fallen short of productivity growth over much of this period.”
* “Overall business investment has turned down as investment in the energy sector has plunged. Business investment fell at an annual rate of 2 percent in first quarter… Business outlays for structures outside of the energy sector also declined in the first quarter…”
The report incorporates the Fed’s projections for US economic growth, published following the June meeting of the central bank’s policy-setting Federal Open Market Committee. They include a downward revision of the projection for 2015 to 1.8 percent-2.0 percent from the March projection of 2.3 percent to 2.7 percent.
That the US economy continues to stagnate and even contract is indicated by two surveys released last week while Yellen was testifying before Congress. The Fed reported that factory production failed to increase in June for the second straight month and output in the auto sector fell 3.7 percent. The Commerce Department reported that retail sales unexpectedly fell in June, declining by 0.3 percent.
These statistics follow the employment report for June, which showed that the share of the US working-age population either employed or actively looking for work, known as the labor force participation rate, fell to 62.6 percent, its lowest level in 38 years. During the month, some 432,000 people in the US gave up looking for a job.
The disastrous figures on business investment are perhaps the most telling indicators of the underlying crisis of the capitalist system. The Fed report attributes the sharp decline so far this year primarily to the dramatic fall in oil prices and resulting contraction in investment and construction in the energy sector. But the plunge in oil prices is itself a symptom of a general slowdown in the world economy.
Moreover, a dramatic decline in productive investment is common to all of the major industrialized economies of Europe and North America. In its World Economic Outlook of last April, the International Monetary Fund for the first time since the 2008 financial crisis acknowledged that there was no prospect for an early return to pre-recession levels of economic growth, linking this bleak prognosis to a general and pronounced decline in productive investment.
The American phenomenon of record stock values fueling an ever greater concentration of wealth at the very top of society, while the economy is starved of productive investment, the social infrastructure crumbles, and working class living standards are driven down by entrenched unemployment, wage-cutting and government austerity policies, is part of a broader global process.
The economic crisis in the US and internationally is not simply a conjunctural downturn. It is a systemic crisis of global capitalism, centered in the US. A defining expression of this crisis is the dominance of financial speculation and parasitism, to the point where a narrow international financial aristocracy plunders society’s resources in order to further enrich itself.
While the economy is starved of productive investment, entirely parasitic and socially destructive activities such as stock buybacks, dividend hikes and mergers and acquisitions return to pre-crash levels and head for new heights. US corporations have spent more on stock buybacks so far this year than on factories and equipment.
The intractable nature of this crisis, within the framework of capitalism, is underscored by the IMF’s updated World Economic Outlook, released earlier this month, which projects that 2015 will be the worst year for economic growth since the height of the recession in 2009.
Lessons
of the fight against Obama’s “school reform”—Part 1
By Nancy Hanover and Jerry White
4 January 2018
The new year will see a
growth of the class struggle throughout the world and within the US, as the
corporate and financial elites demand more austerity from the working class
even as they wallow in levels of personal wealth not seen since the Gilded Age.
After overseeing the
largest tax cut for the rich in US history, the Trump administration is gearing
up to destroy longstanding social benefits, including Medicare, Medicaid and
Social Security. It will make America, already the most unequal advanced
economy in the world, far more unequal.
Trump’s tax legislation
will have massive implications for public education. By capping state and local
tax deductions for individuals, it will likely result in the loss of up to a
quarter of a million public education jobs, as municipalities—which provide 90
percent of school funding—are unable to raise revenues. Governors, mayors and
school district officials from both parties will announce that there is no
money left to maintain quality schools, let alone decent salaries, classroom
conditions and pensions.
Federally-funded
education programs, including Title I, Special Education and Head Start, which
provide benefits to poor or disadvantaged students, will be targeted to pay for
the handouts to the wealthy and giant corporations.
On the other hand, the
Trump measure provides, for the first time, the ability for wealthy families to
invest in tax-free plans for private K-12 schooling, and continues the
lucrative policy allowing charter schools to utilize tax-free Private Activity
Bonds. These changes significantly shift the education tax structure in line
with the privatization policies advocated by Trump’s education secretary Betsy
DeVos.
A new stage of struggle
is on the horizon for teachers, working-class parents and students. Past
experience, however, demonstrates that spontaneous expressions of opposition
are not enough. Educators need a new political strategy and organizations
controlled by rank-and-file teachers and school employees themselves, to
mobilize the working class to defend the right to high quality public education
for all.
The period from 2007 to
2016 saw the fewest major work stoppages in the US of any decade since the
Bureau of Labor Statistics began recording them in 1947. This was not the
result of any complacency among workers, let alone satisfaction with the
historic transfer of wealth from the bottom to the top that occurred during the
Obama years.
On the contrary, it was
the outcome of the deliberate policy of the AFL-CIO and other unions, which
guaranteed the Obama administration “labor peace” in the aftermath of 2008
financial crash, giving the Democratic president a free hand to bail out the
Wall Street banks, starve the states and school districts of funding, and
restructure economic and social relations at the expense of the working class.
In order to maintain
the political straitjacket of the Democratic Party over the working class and
prevent any challenge from below to the financial oligarchy, the American
Federation of Teachers (AFT) and the National Education Association (NEA)
worked overtime to smother the opposition of teachers—above all in the
suppression of the powerful strikes and mass protests that exploded in
Wisconsin in 2011, Chicago in 2012 and Detroit in 2015-16.
Each of these struggles
expressed, in their own way, the determination of teachers to find an
independent road of struggle. Their bold actions galvanized popular support
among high school students, parents and broader sections of the working class
and of middle-class people. To prepare the next stage of struggle, it is
necessary to draw the critical political lessons from these experiences.
Lessons of Wisconsin
The struggle of
Wisconsin teachers and public-sector workers nearly seven years ago was among
the most the important class battles in the US in recent years. On February 14,
2011, Republican Governor Scott Walker introduced Act 10, also known as the
Wisconsin Budget Repair Bill, into the state legislature, providing for
sweeping cuts to public sector workers’ pensions and health care benefits, and
outlawing strikes and collective bargaining. This included a massive $1.25
billion in cuts to school aid and local government.
The response by the
American Federation of State, County and Municipal Employees (AFSCME), the
Wisconsin Education Association Council (WEAC) and other unions was to
acquiesce to Walker’s budget-cutting demands. At the same time, the union
officials organized token protests aimed solely at defending “collective
bargaining.”
While workers
interpreted this to mean protecting their right to fight for improved wages and
conditions, the union bureaucracy had something very different in mind. As mass
protests were beginning, WEAC President Mary Bell said, “This is not about
protecting our pay and our benefits. It is about protecting our right to
collectively bargain.” For the union apparatus “collective bargaining” means
retaining their dues income and state-sanctioned “seat at the table,” where
they negotiate away workers’ hard-earned wages and benefits.
Independently of the
unions, high school students walked out of their classrooms to defend their
teachers, who then followed with a campaign of sickouts. In a matter of days,
the largest working class movement in the US since the 1980s erupted, with
militant workers and young people occupying the state capitol in Madison,
defying Walker’s threats to call out the National Guard, and teachers rejecting
back-to-work orders by WEAC. Support was building for a general strike.
The unions were
thoroughly opposed to a general strike, which would quickly develop into a
political clash not just with Walker but with the Democratic governors in Illinois,
California, New York and other states, and with the Obama administration
itself. The Democrats were carrying out similar austerity measures, albeit with
the collusion of the unions. Wisconsin Democrats chastised Walker, boasting
that his Democratic predecessor, Governor Jim Doyle, had imposed the deepest
austerity cuts in state history, but had accomplished this without popular
resistance, precisely because he worked with the unions.
The unions quickly shut
down the mass movement and peddled the lie that the only means of opposing
Walker was to support recall campaigns to replace the Republican governor and
state senators with Democrats. In 2012, Walker defeated the Democratic
challenger, Milwaukee Mayor Tom Barrett, a shill for big business in the mold
of Hillary Clinton.
By demobilizing the
working class, the unions paved the way for Walker to implement his reactionary
program. Before Act 10 came into effect, the unions moved quickly to impose
multi-year concession contracts on teachers and other state workers in a bid to
maintain their position as bargaining agents.
For teachers, this has
meant:
· 40 percent of school
districts have moved to performance-based pay.
· Teachers are
considered “free agents” and are bargained for competitively by various
districts, creating chaos and “churn” of teachers, with 75 percent of school
districts saying they have lost teachers because a competitor offered a better
salary or benefits.
· Two-thirds of
districts have cut or ended benefits for retirees.
· Class sizes have been
increased and the workday has been lengthened.
· Sixty percent of
districts surveyed said teachers’ average annual salary growth had either
slowed (50%), stopped (8%) or reversed (3%).
· The divide between
better off and poorer districts has been exacerbated. Rural schools and
low-income schools are routinely losing teachers and are more likely to use
inexperienced teachers or those with “emergency” credentials.
No comments:
Post a Comment