Pelosi is a ghastly creature. She and her ilk – Feinstein, Boxer, Jerry Brown, Gavin Newsom – have effectively destroyed California and they did it on purpose. They strive to import as many illegal migrants as possible; they've created and fostered the homelessness and let it fester. California is now a socialist disaster and the further destruction of the economy is just what they've wanted. PATRICIA McCARTHY
The Real Resistance Rises
The Real Resistance Rises
As California’s reactionary Governor cracks down.

Last Wednesday, Gov. Gavin Newsom told reporters he was “weeks not months” from any “modification” of his lockdown order, and the California Highway Patrol was barring any protest at the state Capitol. On Thursday, Newsom shut down state beaches and parks, and on Friday May 1, Californians hit the streets by the thousands, blocking a mile of Pacific Coast Highway down in Orange County, and as Fox News reported, staging protests in San Diego, Los Angeles and San Francisco.
In the state capital of Sacramento, as Katy Grimes of the California Globe noted, “Thousands of flag-waving Californians descended upon the State Capitol Friday for a protest of Gov. Gavin Newsom’s statewide stay-at-home lockdown order, which has caused millions of residents to lose their jobs and businesses.”
The protesters, organized by “Re-Open California,” were not pleading for handouts from the government. For the most part, they were working people who wanted to get their jobs and lives back.
“Reach out to the government and make their concerns, worries, fears, anger, frustration known,” protester Erik Leisten told KCRA News. “Exercise their freedom of speech and right to peacefully assemble and let him know that he’s destroying the state economically, but more importantly our freedoms.”
California Highway Patrol officers in full riot gear formed a line and pushed people off the Capitol grounds. Police arrested 32 demonstrators for disobeying a lawful order, demonstrating without a permit and resisting or delaying a police officer. As Katy Grimes recalled, “police were far less aggressive and few arrests were ever made at Black Lives Matter rallies, which were destructive and violent.”
After the police shooting of Stephon Clark in March of 2018, Black Lives Matter disrupted a Sacramento City Council meeting, blocked fans from entering a Sacramento Kings game, and shut down traffic in both directions on Interstate 5, California’s major north-south artery. A racist mob essentially took over downtown Sacramento, terrorized innocent citizens, and violated laws, but as KCRA reported, police made “no arrests,” during the protest.
By contrast when embattled workers show up at the state Capitol on May 1 to protest their losses, police make 32 arrests. With Gavin Newsom in office, that should come as no surprise.
Last June, Newsom told Politico that Republicans were destined for the “waste bin of history.” So Gov. Newsom is not likely to find their job losses, bankruptcies, foreclosures and such a matter of great concern. Indeed, the progressive governor, a former mayor of San Francisco, could see the current miserable conditions as a fulfillment of his prophecy.
During the 2018 campaign Newsom failed to tour the far reaches of the state, and shortly after election as governor he travelled to El Salvador. The governor supports sanctuary laws that protect Central American and Mexican illegals, even the violent criminals among them. When false-documented illegals get driver’s licenses, the state DMV automatically registers them to vote. This imported electorate gives Newsom more reason to disregard legitimate citizens who vote in ways Democrats might not like.
Gov. Newsom vetoes more than $2 million for a new courthouse in El Dorado County, yet he budgets nearly $100 million to pay the health care of foreign nationals illegally present in the United States, with zero compensation from the illegals’ own countries. During the pandemic, Newsom wants $125 million for illegals’ health care, with $75 million coming from American taxpayers. The governor is also active on the job front, but not for American workers.
With the state economy in freefall, Newsom struck a $1 billion deal with the Chinese company BYD for more than 200 million masks, in a state of 40 million people. Newsom hid details of the deal, even from fellow Democrats who gave him extraordinary powers during the pandemic. Long before the coronavirus showed up from China, state Democrats were making it hard for California workers to earn a living.
Last year, Gov. Newsom signed California Assembly Bill 5, a virtual declaration of war against independent contractors, including those in the medical field. AB-5 is the first measure openly to oppose the professions Californians choose for themselves, the first measure to deny Californians their rights of free association, and the first measure to limit workers’ ability to earn a living. Newsom has refused to suspend the measure, even as the pandemic punishes the workers.
Gov. Newsom openly violates federal immigration law but puts the state Capitol off-limits to American workers who only want their jobs and lives back. When more than 1,000 peaceful protesters show up, his black-clad staatspolizei arrest them by the dozens. Even so, they will keep taking it to the streets, all across the Golden State.
Californians boast a long tradition of public protest, with a sound track laid down in the sixties. They have been crushed by the tumbling tide, as the Chambers Brothers put it, so the time has come today, and “there are things to realize.” Once again, as the Buffalo Springfield said, there’s a thousand people in the street, singing songs and carrying signs.
In a state like
Florida, where immigrants make up about 25.4 percent of the labor force,
American workers have their weekly wages reduced by about 12.5 percent. In
California, where immigrants make up 34 percent of the labor force, American
workers’ weekly wages are reduced by potentially 17 percent.
The Internal Battle for America
America! “I want you to get up right now and go to the window...open it and stick your head out and yell, “I'm as mad as hell and I'm not gonna take this anymore!” That is from the 1976 movie, Network. It is the appropriate response to totalitarian governors, hellbent on keeping their constituents in lock-down bondage to further their anti-Trump agenda.
Folks, I am sick of seeing Dr. Fauci and Dr. Birx promise that if we are good, they will feed us teaspoons of our constitutional freedoms at their discretion. I am sick of TV commercials designed to frighten and shame us into obeying tyrannical governors. I am sick of TV images of exhausted health workers to sell the lie that hospitals are overwhelmed with coronavirus patients. I am sick of well-meaning people ending conversations with “Stay safe” as if a unique monster is lurking outside. I am sick of pundits saying we need to reopen America safely and responsibly as if going back to normal life is unthinkable and dangerous. Dr. Ben Carson announced that 98% of people who get coronavirus recover.
Despite all our social distancing, research shows far more people were infected than officially confirmed. This means coronavirus is no way near as lethal as we were told. Health experts say herd immunity is the best way to fight the virus. And yet, stating this scientific truth will get you branded a dangerous nutcase by the media. God designed us to deal with viruses. As usual, arrogant men (typically leftist) believe they know better than God. Meanwhile, doctors are ordered to lie about the numbers by labeling practically all deaths coronavirus. This will keep federal funding coming and Americans panicked.
Evidence confirms that the coronavirus lockdown is a political weapon for Democrats to defeat Trump in November. Fear of this flu virus also gifts them an opportunity to behave like totalitarians, freely implementing their communist agenda.
To end this insane lockdown which is crushing lives and our economy we must push back with protests, protests, and more protests.
That sound of roaring thunder you hear is the resurgence of the Tea Party. Facebook boldly announced that they will shut down pages which promote protests against the lockdown. We beat fake news media in the past and we will beat them again. Despite a media blackout in 2010, the Tea Party drew 1.7 million Americans to Washington D.C. to oppose ObamaCare. We have the power of right on our side and we will not be defeated.
 While Dr. Fauci and
Dr. Birx enjoy their
comfortable elitist
lifestyles, I hear
horrific tales of
Americans afraid and
suffering; dying not
from the virus, but the
related stress. Corona-madness has caused
suicides to skyrocket. A Maryland friend said 20 cars were broken into in her middle-class neighborhood. People are becoming desperate. The irresponsible promotion of fear has neighbors feuding; mask wearers vs non mask wearers. Neighbors are ratting on those who do not obey social distancing. Are we all experiencing an episode of the “Twilight Zone” in which Nazi tyrants have taken over our country?
The American people are good, decent, and fair-minded. They consented to sheltering-in-place because we were told two million Americans would die if we did not. Now that health experts and researchers have ripped the mask off the fake news-media-created coronavirus crisis, Americans are demanding their constitutional freedoms back. They want to return to their normal lives. Their desire is neither stupid, irresponsible, or crazy.
As we rebel against this strategic, evil lockdown, please keep our president in your prayers. His heart's desire is to reopen America asap. Democrats and fake news media behaviorally say, “Screw the American people!” We will demand that the country remain locked down to election day. We will say everything Trump does regarding coronavirus is wrong, crazy, incompetent, and deadly. Democrat and fake news media are pure evil domestic terrorists.
Coronavirus has given Democrats a taste of unbridled power. They ain't gonna give that up. This is why We the People must unite and engage in a nationwide revolt. We must take back our country!
Democrats and fake news media routinely launch a false narrative and bully us into surrendering to it. Their latest unscientifically proven narrative says social distancing is the responsible way to deal with coronavirus. Health experts and scientists who dare to disagree are severely bludgeoned 24/7; bloodied by TV talking heads and social and legacy media. Then, they are dragged into the high-tech public square to be humiliated and seared with a hot branding iron, marked for life as stupid, a hater, and dangerous. We have repeatedly seen them implement this brutal tactic.
To shame us into not protesting their lockdown, Democrats and fake news media say we are racist wackos who reject science. Can you say pot calling the kettle black, boys and girls? Democrats and fake news media viciously demand that we reject science.
For example: Science says “sex change” is biologically impossible. Stating this scientific fact will get you crucified by Democrats and fake news media. Scientists whose research contradict Democrats and fake news medias' narrative of man-made climate change are threatened with jail time.
Democrats can hardly contain their joy over the power coronavirus has given them to finally implement Obama's failed “transformation of America” into a socialist/communist country. It is our sacred and patriotic duty to forcibly push the break peddle; fight to defend our Constitution and make America great again. In the words of our 9/11 hero, Todd Beamer, “Let's roll!”
Lloyd Marcus, The Unhyphenated American
Bernie
Sanders: ‘Of Course’ Cheap Illegal Workers Drive Down U.S. Wages….WHY DOES
HE WANT AMNESTY AND WIDER OPEN BORDERS OTHER THAN TO BUY THE ILLEGALS’ VOTES???
Andrew
Harnik/AP Photo
14 Jan 2020326
3:30
Sen. Bernie Sanders (I-VT) admits
cheaper illegal alien workers drive down wages for America’s working and middle
class but continues to support amnesty for illegal aliens, decriminalization of
the United States-Mexico border, and throwing out President Trump’s “Buy
American, Hire American” executive order.
Sanders navigated through the issue
during an interview with the New
York Times, attempting to explain his previous statements where he
has admitted that opening
the U.S. border is detrimental to the nation-state and has slammed the concept
of hemispheric open borders.
During the exchange, Sanders says
“of course” cheaper illegal alien workers hired by businesses at “$5 an hour”
will “lower wages” for America’s working class, who are often looking for
entry-level jobs.
“Yeah, if you’re being paid $5 — if
you’re being paid $5 an hour, now of course it’s going to lower wages,” Sanders
said. “Why would I hire at a higher wage?”
Later in the interview, though,
Sanders backs away from immigration’s wage-suppression impact on Americans and
focuses on a $15 minimum wage — suggesting that illegal aliens be legalized and
paid the same wage as Americans.
“All I am saying is that if for
whatever reason, I’m paying you $5 an hour, okay,” Sanders said. “You don’t
think that’s going to lower the wages that she gets?”
Legal immigration levels, where 1.2
million mostly low-skilled legal immigrants and hundreds of thousands of foreign
visa workers are admitted to the country annually, have driven the number of
foreign born workers in the U.S. to its highest level since 1996. This is in
addition to the hundreds of thousands of illegal aliens who enter the country
every year.
Most immigrants to the U.S.
immediately begin competing for blue-collar and white-collar jobs against millions of Americans who
want full-time employment.
No
Labor Shortage: 11M Americans Out of Work, But All Want Full-Time Jobs https://www.breitbart.com/politics/2020/01/10/no-labor-shortage-11m-americans-out-of-work-but-all-want-full-time-jobs/ …
No Labor Shortage: 11M Americans Out of Work but Want
Full-Time Jobs
Extensive research by economists
like George Borjas and analyst Steven Camarota reveals that the country’s
current mass legal immigration system burdens U.S. taxpayers and America’s
working and middle class while redistributing about $500 billion in wealth
every year to major employers and newly arrived immigrants. Similarly, research
has revealed how Americans’ wages are crushed by the
country’s high immigration levels.
For every one percent increase in
the immigrant portion of American workers’ occupations, their weekly wages are
cut by about 0.5 percent, Camarota finds. This means the average native-born
American worker today has his weekly wages reduced by perhaps 8.75 percent
since 17.5 percent of the workforce is foreign born.
In a state like Florida, where
immigrants make up about 25.4 percent of the labor force, American workers have
their weekly wages reduced by about 12.5 percent. In California, where
immigrants make up 34 percent of the labor force, American workers’ weekly
wages are reduced by potentially 17 percent.
Likewise, every one-percent increase
in the immigrant portion of low-skilled U.S. occupations reduces wages by about
0.8 percent. Should 15 percent of low-skilled jobs be held by foreign-born
workers, it would reduce the wages of native-born American workers by perhaps 12
percent.
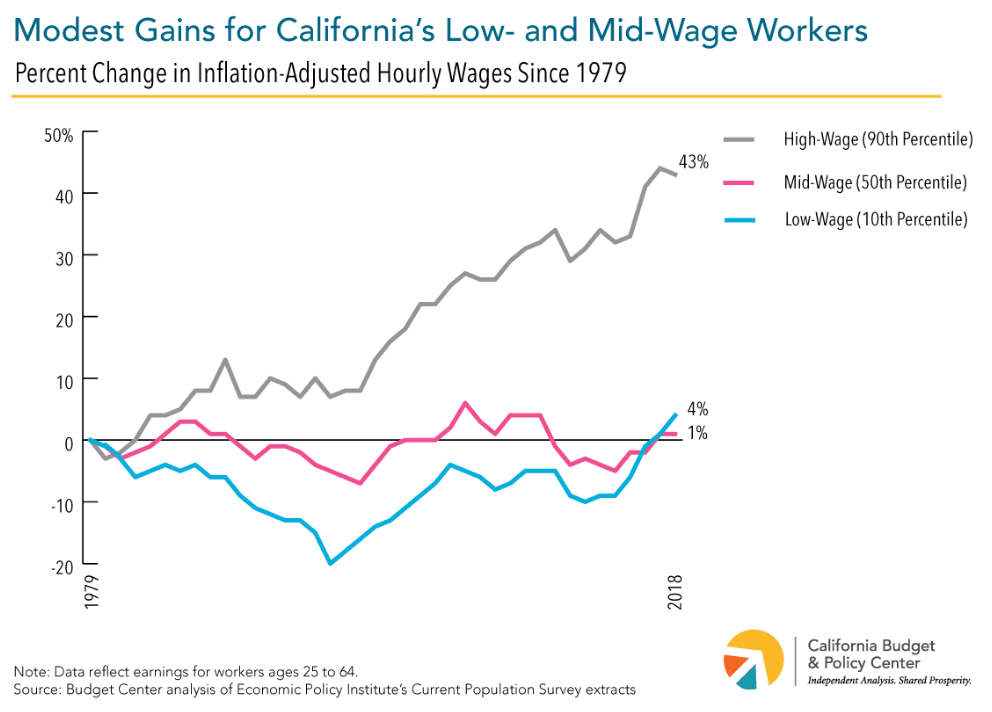
Report:
California’s Middle-Class Wages Rise by 1 Percent in 40 Years
Middle-class
wages in progressive California have risen by 1 percent in the last 40 years,
says a study by the establishment California Budget and Policy Center.
“Earnings for California’s
workers at the low end and middle of the wage scale have generally declined or
stagnated for decades,” says the report, titled “California’s Workers Are
Increasingly Locked Out of the State’s Prosperity.” The report continued:
In
2018, the median hourly earnings for workers ages 25 to 64 was $21.79, just 1%
higher than in 1979, after adjusting for inflation ($21.50, in 2018 dollars)
(Figure 1). Inflation-adjusted hourly earnings for low-wage workers, those at
the 10th percentile, increased only slightly more, by 4%, from $10.71 in
1979 to $11.12 in 2018.
The report admits that the
state’s progressive economy is delivering more to investors and less to
wage-earners. “Since 2001, the share of state private-sector [annual new income]
that has gone to worker compensation has fallen by 5.6 percentage points — from
52.9% to 47.3%.”
In 2016, California’s Gross
Domestic Product was $2.6 trillion, so the 5.6 percent drop shifted $146
billion away from wages. That is roughly $3,625 per person in 2016.
The report notes that wages
finally exceeded 1979 levels around 2017, and it splits the credit between the
Democrats’ minimum-wage boosts and President Donald Trump’s go-go economy.
The 40 years of flat wages are
partly hidden by a wave of new products and services. They include almost-free
entertainment and information on the Internet, cheap imported coffee in
supermarkets, and reliable, low-pollution autos in garages.
But the impact of California’s
flat wages is made worse by California’s rising housing costs, the report says,
even though it also ignores the rent-spiking impact of the establishment’s
pro-immigration policies:
In just the last decade
alone, the increase in the typical household’s rent far outpaced the rise in
the typical full-time worker’s annual earnings, suggesting that working
families and individuals are finding it increasingly difficult to make ends
meet. In fact, the basic cost of living in many parts of the state is more
than many single individuals or families can expect to earn, even if all adults
are working full-time.
…
Specifically, inflation-adjusted
median household rent rose by 16% between 2006 and 2017, while
inflation-adjusted median annual earnings for individuals working at least 35
hours per week and 50 weeks per year rose by just 2%, according to a Budget
Center analysis of US Census Bureau, American Community Survey data.
Many workers are being paid
little more today than workers were in 1979 even as worker productivity has
risen. Fewer employees have access to retirement plans sponsored by their
employers, leaving individual workers on their own to stretch limited dollars
and resources to plan how they’ll spend their later years affording the high cost
of living and health care in California. And as union representation has
declined, most workers today cannot negotiate collectively for better working
conditions, higher pay, and benefits, such as retirement and health care, like
their parents and grandparents did. On top of all this, workers who take on
contingent and independent work (often referred to as “gig work”), which in
many cases appears to be motivated by the need to supplement their primary job
or fill gaps in their employment, are rarely granted the same rights and legal
protections as traditional employees.
The center’s report tries to
blame the four-decade stretch of flat wages on the declining clout of unions.
But unions’ decline was impacted by the bipartisan elites’ policy of
mass-migration and imposed diversity.
In
2018, Breitbart reported how Progressives for
Immigration Reform interviewed Blaine Taylor, a union carpenter, about the
economic impact of migration:
TAYLOR: If I hired a framer to do
a small addition [in 1988], his wage would have been $45 an hour. That was
the minimum for a framing contractor, a good carpenter. For a helper, it was
about $25 an hour, for a master who could run a complete job, it was about $45
an hour. That was the going wage for plumbers as well. His helpers typically
got $25 an hour.
…
Now, the average wage in Los Angeles
for construction workers is less than $11 an hour. They can’t go lower than the
minimum wage. And much of that, if they’re not being paid by the hour at less
than $11 an hour, they’re being paid per piece — per piece of plywood that’s
installed, per piece of drywall that’s installed. Now, the subcontractor can
circumvent paying them as an hourly wage and are now being paid by 1099, which
means that no taxes are being taken out. [Emphasis added]
Diversity
also damaged the unions by shredding California’s civic solidarity. In 2007,
the progressive Southern Poverty Law Center posted a report with the title
“Latino Gang Members in Southern California are Terrorizing and Killing
Blacks.” In the same year, an op-ed in the Los Angeles Times described another murder by Latino
gangs as “a manifestation of an increasingly common trend: Latino ethnic
cleansing of African Americans from multiracial neighborhoods.”
The center’s board members
include the executive director of the state’s SEIU union, a professor from the
Goldman School of Public Policy at the University of California, Berkeley, and
the research director at the “Program for Environmental and Regional Equity” at
the University of Southern California, Los Angeles.
Outside
California, President Donald Trump’s low-immigration policies are pressuring
employers to raise Americans’ wages in a hot economy. The Wall Street Journal reportedAugust 29:
Overall, median weekly earnings
rose 5% from the fourth quarter of 2017 to the same quarter in 2018, according
to the Bureau of Labor Statistics. For workers between the ages of 25 and 34,
that increase was 7.6%.
The New York Times laments that reduced
immigration does force wages upwards and also does force companies to buy
labor-saving, wage-boosting machinery. Instead, NYT prioritizes "ideas
about America’s identity and culture.” http://bit.ly/2Zp2u2J
NYT Admits Fewer
Immigrants Means Higher Wages, More Labor-Saving Machines
.
THE INVITED INVADING HORDES: IT’S ALL
ABOUT KEEPING WAGES DEPRESSED!
"In the decade following the
financial crisis of 2007-2008, the capitalist class has delivered powerful
blows to the social position of the working class. As a result, the working
class in the US, the world’s “richest country,” faces levels of economic
hardship not seen since the 1930s."
"Inequality has reached unprecedented
levels: the wealth of America’s three richest people now equals the net
worth of the poorest half of the US population."
PAUL BEDARD
- THE STAGGERING COST OF MEXICO'S OCCUPATION AND LOOTING - Should we be helping
our own instead?
Record $135 billion a year for illegal immigration, average
$8,075 each, $25,000 in NY
http://www.washingtonexaminer.com/record-135-billion-a-year-for-illegal-immigration-average-8075-each-25000-in-ny/article/2635757
The swelling population
of illegal immigrants and their kids is costing American taxpayers $135 billion
a year, the highest ever, driven by free medical care, education and a huge law
enforcement bill, according to the the most authoritative report on the issue
yet.
And despite claims from
pro-illegal immigration advocates that the aliens pay significant off-setting
taxes back to federal, state and local treasuries, the Federation
for American Immigration Reform report tallied just $19 billion, making the final hit to
taxpayers about $116 billion.
State and local
governments are getting ravaged by the costs, at over $88 billion. The federal
government, by comparison, is getting off easy at $45 billion in costs for
illegals.
President Trump,
Attorney General Jeff Sessions and conservatives in Congress are moving
aggressively to deal with illegals, especially those with long criminal
records. But their effort is being fought by courts and some 300 so-called
"sanctuary communities" that refuse to work with federal law
enforcement.
The added burden on
taxpayers and the unfairness to those who have applied to come into the United
States through legal channels is also driving the administration's immigration
crackdown.
The report,
titled "The
Fiscal Burden Of Illegal Immigration on U.S. Taxpayers," is the most
comprehensive cost tally from FAIR. It said that the costs have jumped about $3
billion in four years and will continue to surge unless illegal immigration is
stopped. It was provided in advance exclusively to Secrets.
"Clearly, the cost
of doing nothing to stop illegal immigration is far too high," said FAIR
Executive Director Dan Stein. "President Trump has laid out a
comprehensive strategy to regain control of illegal immigration and bring down
these costs," said Stein. "Building the wall, enhancing interior
enforcement and mandating national E-Verify will go a long way in bringing
these ridiculously high costs under control," he added.
Over 68 often shocking
pages, FAIR documents the average $8,075 in state, local and federal spending
for each of the of 12.5 million illegal immigrants and their 4.2 million
citizen children.
Broadly, the costs
include $29 billion in medical care, $23 billion for law enforcement, $9
billion in welfare, $46 billion for education.
Just consider the cost
of teaching an illegal alien child who doesn't speak English. FAIR estimates an
average cost of over $12,000 a year, and that can reach $25,000 in New York.
Add to that welfare, health care, school lunches, and the per student price
soars.
In state costs alone,
California leads the list at $23 billion per year, followed by Texas at $11
billion, and New York at $7.4 billion.
And it also documents
the taxes paid and how they don't come close to offsetting the costs. What's
more, FAIR noted that 35 percent of the illegal population operate in an
underground economy hidden from tax collectors. And worse, employers hire
illegals and either pay them cheaply or under the table.
"The United States
recoups only about 14 percent of the amount expended annually on illegal
aliens. If the same jobs held by illegal aliens were filled by legal workers,
at the prevailing market wage, it may safely be presumed that federal, state
and local governments would receive higher tax payments," said FAIR.
Key findings pulled
from the report:
·
The staggering total costs of illegal immigrants and their
children outweigh the taxes paid to federal and state governments by a ratio of
roughly 7 to 1, with costs at nearly $135 billion compared to tax revenues at
nearly $19 billion.
·
The nearly $135 billion paid out by federal and state and local
taxpayers to cover the cost of the presence of 12.5 million illegal aliens and
their 4.2 million citizen children amounts to approximately $8,075 per illegal
alien and citizen child prior to taxes paid, or $6,940 per person after taxes
are paid.
·
On the federal level, medical ($17.14 billion) is by far the
highest cost, with law enforcement coming second ($13.15 billion) and general
government services ($8 billion) third.
·
At the state and local level, education ($44.4 billion) was by
far the largest expense, followed by general public services ($18.5 billion)
and medical ($12.1 billion).
·
The top three states based on total cost to state taxpayers for
illegal immigrants and their children: California ($23 billion); Texas ($10.9
billion), and New York ($7.5 billion).
Paul Bedard, the Washington Examiner's "Washington
Secrets" columnist, can be contacted at pbedard@washingtonexaminer.com
More than 52 million Americans live
in economically distressed communities
By Sandy
English
28 September 2017
A new analysis of Census data shows that the so-called economic
recovery under the Obama administration was an unmitigated catastrophe for the
20 percent of the American population that live in the poorest areas of the
United States and that gains of jobs and income have gone overwhelming to the
top 20 percent richest areas.
“The 2017 Distressed Communities Report,” published by the Economic Innovation Group (EIG), analyzes
the census data for 2011-2015 for people living in each of the nearly 7,500
American zip codes according to several criteria.
The EIG’s Distressed Communities Index (DCI) considers the
percentage of the population without a high school diploma, the percentage of
housing vacancies, the percentage of adults working, the percentage of the
population in poverty, the median income ratio (the percentage of median income
that a zip code has for its state), the change in employment from 2011 to 2015,
and the change in the number of businesses in the same period.
The report divides the findings for zip codes into five
quintiles based on these indicators, rated from worst- to best-performing:
distressed, at risk, mid-tier, comfortable, and prosperous.
The results show that distressed communities—52.3 million people
or 17 percent of the American population—experienced an average 6 percent drop
in the number of adults working and a 6.3 percent average drop in the number of
business establishments.
“Far from achieving even anemic growth from 2011 to 2015,” the
report notes, “distressed communities instead experienced what amounts to a
deep ongoing recession.”
Further, “fully one third of the approximately 44 million
Americans receiving SNAP (Supplemental Nutrition Assistance Program or food
stamps) and other cash public assistance benefits (such as Temporary Assistance
for Needy Families (TANF)) live in distressed communities.” The report notes
that most distressed communities have seen zero net job growth since 2000.
Residents in these zip codes are five times more likely to die
than those in prosperous zip codes. Deaths from cancer, pregnancy
complications, suicide, and violence are even higher. “Mental and substance
abuse disorders are 64 percent higher in distressed counties than prosperous
ones, with major clusters in Appalachia and Native American communities where
rates exceed four or five times the national average,” the report continues.
One other important and alarming fact which the report
highlights is that over a third of the distressed zip codes contain so-called
“brownfield” sites—areas which are polluted or contaminated in some way. Not
only do these have impacts on real estate and business development, they
present a whole array of health hazards to the very poorest Americans.
Distressed communities can be found all over the United States
but are concentrated in the South: 43 percent of Mississippi’s zip codes are
distressed, followed by Alabama, West Virginia, Arkansas and Louisiana.
According to the report, [the South] “is home to a staggering 52 percent of all
Americans living in distressed zip codes—far above its 37.5 percent share of
the country’s total population.”
After this, the Southwest and Great Lakes region have the
largest share. In the Northeast, most distressed communities tend to be found
in urban areas and in the South, primarily in rural areas.
The biggest cities with the largest numbers of distressed zip
codes are Cleveland, Ohio, Newark, New Jersey, Buffalo, New York, Detroit,
Michigan and Toledo, Ohio. Mid-sized cities with the highest number of
distressed zip codes include Youngstown, Ohio, Trenton, New Jersey, Camden, New
Jersey, Gary, Indiana, Hartford, Connecticut and Flint, Michigan.
Urban counties with the highest number of distressed zip codes
include Cook County in Illinois, with Chicago at its center, Los Angeles County
in California, Harris County in Texas, with Houston at its center, and Wayne
County in Michigan, encompassing Detroit. Most of these urban areas were once
industrial centers and home to the industrial working class.
Distressed zip codes that have a majority of minorities living
in them are more than twice as likely to be distressed as zip codes that are
majority white. “In total,” the report notes, “45 percent of the country’s
majority-minority zip codes are distressed and only 7 percent of them are
prosperous.” At the same time there are numerous distressed communities that
are almost completely white. A quarter of the total distressed population is
under 18.
The report found that the economic benefits of the recovery
after the 2008 recessions have gone to the top quintile of zip codes, where the
wealthier layers of the population live, including not only the very rich but
also the upper middle class.
These areas, which the DCI terms prosperous, and make up roughly
85 million Americans or 27 percent of the US population, have for the most part
the economic wherewithal to finance higher levels of education, have the lowest
housing vacancy, highest percentage of working adults, and have had the lion’s
share of job and business expansion.
“The job growth rate in the top quintile was 2.6 times higher
than nationally from 2011 to 2015, and business establishments proliferated
three times faster than they did at the national level,” the report notes.
“Prosperous zip codes stand worlds apart from their distressed counterparts,
seemingly insulated from many of the challenges with which other communities
must grapple. The poverty rate is more than 20 points lower in the average
prosperous community than it is in the average distressed one.”
The report makes much less of an analysis of the other three,
middle quintiles, the at risk, mid-tier, and comfortable categories, but it
does note some trends that address the overall trends nation-wide. “A
remarkably small proportion of places fuel national increases in jobs and
businesses in today’s economy. High growth in these local economic powerhouses
buoys national numbers while obscuring stagnant or declining economic activity
in other parts of the country.”
One of the more telling aspects of the report is that extreme
poverty in the US is presided over by both capitalist parties: Democratic and
Republic politicians have equal numbers of distressed communities in their
constituencies. Democrats, in fact, “represent six of the 10 most distressed
congressional districts.”
Another observation from the voting data, and one of the few
that looks at conditions beyond the bottom and top quintiles, is worth quoting
in full:
“President Trump accumulated a 3.5 million vote lead in counties
that fell into the bottom three quintiles of well-being (equivalent to 9.4
percent of all votes cast in these counties). A vast array of factors
determined voting patterns in the 2016 election, but it stands that the
‘continuity’ candidate performed better in the places benefiting most from the
status quo, while the ‘change’ candidate performed better in the places one
would expect to find more dissatisfaction.”
Broader figures and the historical view of wealth distribution
in the US—that one percent of the population control 40 percent of the wealth
or the decades-long decline in the percentage of the national income that goes
to the working class—is not brought out in the report but the data add to a
complete picture of social conditions across the United States, the character
and geographical distribution of social and economic conditions in a country of
more than 320 million.
The portrait provided by the EIG report is not simply one of
increasing misery and poverty for the bottom 20 percent, and not only one in
which only a minority of Americans are achieving anything like “prosperity,”
but of growing and explosive dissent among tens of millions.
It exposes as a bold-faced lie the claim that President Obama
made at the end of his second term, that “things have never been better” in
America.
September 20, 2017
The Awful Future that Looms for a Majority of Today’s
Americans
When it
comes to the future, an overwhelming majority of Americans have adopted a
mindset that is a variation of Isiah 22:12: “Let us eat, drink and be merry for
tomorrow does not matter.” Recently, federal debt surpassed the $20
Trillion mark (additional state and local debt amount to another $2.9
Trillion). That milestone was greeted by the
Ruling Class and a vast preponderance of the citizenry with a yawn and a shrug
of the shoulder. As the ongoing determination to promote new
entitlement spending and the refusal to rein in, but instead to expand,
existing programs continues unabated.
Any
attempt to seriously discuss the financial fate of the nation is ignored and
dismissed with the proviso that its someone else’s problem for another day down
the road. In reality, this dilemma is not someone else’s problem.
The average life expectancy in the United States today is 79. That means
that over 225 million citizens and non-citizens in the country today will still
be alive in 30 years.
And what
will this nation be facing 30 years hence? Recently, the Government Accountability
Office as well as a number of experts such as Price
Waterhouse have projected what that scenario will
be if the country remains on its present course (with no new entitlements such
as single payer health care and government mandated and paid maternity leave.)
Note: All dollar amounts are in 2017 Dollars.
A.
Federal, State
and local government spending currently amounts to $7 Trillion per year
or 37% of the nation’s Gross
Domestic Product (GDP). By 2048 these
entities combined will be spending in excess of $17 Trillion per year, or over
50% of GDP. As interest costs on the overall debt will increase
from $0.4 Trillion to $2.4 Trillion, healthcare spending (includes Obamacare
subsidies) will vault from $1.6 Trillion to $3.7 Trillion, Social Security and
pension payments will grow from $1.4 Trillion to $3.5 Trillion, education
spending from $1 Trillion to $2.4 Trillion, and welfare programs from $0.5
Trillion to $1.3 Trillion.
B. The dramatic increase in spending
and borrowing combined with the inevitable necessity of increased tax rates
will crowd out private and public investment thereby slowing the growth of
productivity, worker’s wages and the GDP. The Congressional Budget Office
estimates that by 2040 the average annual real income per person will fall by
$6,000.00. Thus, by 2048 the GDP of the United States
will lag significantly behind China and India, as it falls to third place among
the nations of the world. The U.S. GDP will increase only 76% by 2048
while government spending increases by 142%.
C. Concurrent with and because of
the spending, stagnant growth and reduced personal income, the overall
government debt will increase significantly as tax proceeds (despite eventual
higher rates) will not generate anything close to the revenue necessary to
offset spending, as tax revenues to the Federal, State and local governments
will not exceed 30% of the GDP, whereas spending will absorb 51% of the GDP.
By 2048 the overall government debt (Federal, State and local may well exceed
$68 Trillion as compared to $23 Trillion today. Thus, the interest costs
will increase fivefold, as not only does the debt swell, but the United States
will have to appeal to lenders willing to underwrite a nearly bankrupt
nation. Today this country, with 5% of the world’s population, accounts
for over 32%
of Global debt, but by 2048 it will account for
49% of Global debt. In essence, America will be at the mercy of the rest
of the world and a second-tier economy.
D. Over the next 30 years there will
be inevitable recessions, global financial crises and international military
encounters. The United States will, with this level of debt and
spending, find itself in an increasingly precarious position, as it may not be
able to successfully weather any serious economic downturn or global conflict.
E. The above statistics do not
include the current Democratic Party’s love affair with single-payer healthcare
or “Medicare for all.” If that program were included, the annual
government expenditures in 2048 (over and above current healthcare spending and
interest costs) would balloon from $17 Trillion to $20 Trillion (60% of
annual GDP) (and the debt would grow from $68 Trillion
to over $86 Trillion.
The
tsunami that will inundate this nation is inevitable as there is no
willingness, regardless of party, to confront these issues.
The
Democrats and their mind-numbed followers, now fully wedded to socialism, have
convinced each other, and unfortunately much of the citizenry, that there is a
bottomless pit of money to be siphoned from the so-called rich and the golden
goose that is Capitalism, the engine of the nation’s GDP, will continue in
perpetuity to lay the gold eggs regardless of any abuse or restraint. The
one-time confiscation of the wealth of all the billionaires in the U.S. would
amount to $2.2 Trillion (less than 31% of all government spending in
2017). Further, Capitalism cannot thrive without capital and profit, both
of which the Democrats would severely restrict and control, thus, exacerbating the
scenario outlined above.
The
Republicans, while cognizant of the dire future ahead, prefer to hide their
heads in the sand and defer matters to another day and another Congress and
another President, as they are fearful of telling the people the truth and risk
losing political power. Thus, their pre-determined inability and lack of
fortitude in addressing Obamacare or any long-term spending programs.
Donald
Trump continues to tout new programs (such as paid maternity leave), adamantly
refuses to address the out of control entitlement spending, and is content with
modified single-payer health care. He claims that economic growth will
take care of all the problems; however, unless he and his successors find a way
to grow the economy at an annual 5-7% per year for the next 20 to 30 years,
that platitude is meaningless (the highest ten-year period of GDP growth --
6.7% -- in the past 100 years took place in 1939-1948, which
included massive war production for World War II). President Trump, has
no plan or desire to mitigate the disaster looming on the horizon preferring to
kick the can down the road while mouthing the usual banalities about reining in
spending.
Thus, the
populace, instead of being aware of the disaster ahead, is taking its lead from
the Ruling Class. Alternatively, the American people are blithely
swimming in a sea of banalities and faux causes. Whether it is promoting
transgenderism, drowning in cults of personality, defacing and tearing down
statues, feverously looking for supposed racism under every rock, asserting
hypothetical compassion in the promotion of open borders and amnesty for untold
millions, breathlessly endorsing the false God of climate change, cheering for
their side of the political spectrum to humiliate the other, or demanding that
government make their lives better.
I will
not be among the 225 million Americans living today that will be alive in
2048. I have been fortunate to live throughout the golden age of
America’s power and influence, but regrettably to also see the impending end of
this glorious and short-lived era. The true tragedy is that those
225 million refuse to understand that for them there is no tomorrow to
disregard.
When it
comes to the future, an overwhelming majority of Americans have adopted a
mindset that is a variation of Isiah 22:12: “Let us eat, drink and be merry for
tomorrow does not matter.” Recently, federal debt surpassed the $20
Trillion mark (additional state and local debt amount to another $2.9
Trillion). That milestone was greeted by the
Ruling Class and a vast preponderance of the citizenry with a yawn and a shrug
of the shoulder. As the ongoing determination to promote new
entitlement spending and the refusal to rein in, but instead to expand,
existing programs continues unabated.
Any
attempt to seriously discuss the financial fate of the nation is ignored and
dismissed with the proviso that its someone else’s problem for another day down
the road. In reality, this dilemma is not someone else’s problem.
The average life expectancy in the United States today is 79. That means
that over 225 million citizens and non-citizens in the country today will still
be alive in 30 years.
And what
will this nation be facing 30 years hence? Recently, the Government Accountability
Office as well as a number of experts such as Price
Waterhouse have projected what that scenario will
be if the country remains on its present course (with no new entitlements such
as single payer health care and government mandated and paid maternity leave.)
Note: All dollar amounts are in 2017 Dollars.
A.
Federal,
State and local government spending currently amounts to $7 Trillion per year
or 37% of the nation’s Gross
Domestic Product (GDP). By 2048 these
entities combined will be spending in excess of $17 Trillion per year, or over
50% of GDP. As interest costs on the overall debt will increase
from $0.4 Trillion to $2.4 Trillion, healthcare spending (includes Obamacare subsidies)
will vault from $1.6 Trillion to $3.7 Trillion, Social Security and pension
payments will grow from $1.4 Trillion to $3.5 Trillion, education spending from
$1 Trillion to $2.4 Trillion, and welfare programs from $0.5 Trillion to $1.3
Trillion.
B. The dramatic increase in spending
and borrowing combined with the inevitable necessity of increased tax rates
will crowd out private and public investment thereby slowing the growth of
productivity, worker’s wages and the GDP. The Congressional Budget Office
estimates that by 2040 the average annual real income per person will fall by
$6,000.00. Thus, by 2048 the GDP of the United States
will lag significantly behind China and India, as it falls to third place among
the nations of the world. The U.S. GDP will increase only 76% by 2048
while government spending increases by 142%.
C. Concurrent with and because of
the spending, stagnant growth and reduced personal income, the overall
government debt will increase significantly as tax proceeds (despite eventual
higher rates) will not generate anything close to the revenue necessary to
offset spending, as tax revenues to the Federal, State and local governments
will not exceed 30% of the GDP, whereas spending will absorb 51% of the
GDP. By 2048 the overall government debt (Federal, State and local may
well exceed $68 Trillion as compared to $23 Trillion today. Thus, the
interest costs will increase fivefold, as not only does the debt swell, but the
United States will have to appeal to lenders willing to underwrite a nearly
bankrupt nation. Today this country, with 5% of the world’s population,
accounts for over 32%
of Global debt, but by 2048 it will account for
49% of Global debt. In essence, America will be at the mercy of the rest
of the world and a second-tier economy.
D. Over the next 30 years there will
be inevitable recessions, global financial crises and international military
encounters. The United States will, with this level of debt and
spending, find itself in an increasingly precarious position, as it may not be
able to successfully weather any serious economic downturn or global conflict.
E. The above statistics do not
include the current Democratic Party’s love affair with single-payer healthcare
or “Medicare for all.” If that program were included, the annual
government expenditures in 2048 (over and above current healthcare spending and
interest costs) would balloon from $17 Trillion to $20 Trillion (60% of
annual GDP) (and the debt would grow from $68 Trillion
to over $86 Trillion.
The
tsunami that will inundate this nation is inevitable as there is no
willingness, regardless of party, to confront these issues.
The
Democrats and their mind-numbed followers, now fully wedded to socialism, have
convinced each other, and unfortunately much of the citizenry, that there is a
bottomless pit of money to be siphoned from the so-called rich and the golden
goose that is Capitalism, the engine of the nation’s GDP, will continue in
perpetuity to lay the gold eggs regardless of any abuse or restraint. The
one-time confiscation of the wealth of all the billionaires in the U.S. would
amount to $2.2 Trillion (less than 31% of all government spending in
2017). Further, Capitalism cannot thrive without capital and profit, both
of which the Democrats would severely restrict and control, thus, exacerbating
the scenario outlined above.
The
Republicans, while cognizant of the dire future ahead, prefer to hide their
heads in the sand and defer matters to another day and another Congress and
another President, as they are fearful of telling the people the truth and risk
losing political power. Thus, their pre-determined inability and lack of
fortitude in addressing Obamacare or any long-term spending programs.
Donald
Trump continues to tout new programs (such as paid maternity leave), adamantly
refuses to address the out of control entitlement spending, and is content with
modified single-payer health care. He claims that economic growth will
take care of all the problems; however, unless he and his successors find a way
to grow the economy at an annual 5-7% per year for the next 20 to 30 years,
that platitude is meaningless (the highest ten-year period of GDP growth --
6.7% -- in the past 100 years took place in 1939-1948, which
included massive war production for World War II). President Trump, has
no plan or desire to mitigate the disaster looming on the horizon preferring to
kick the can down the road while mouthing the usual banalities about reining in
spending.
Thus, the
populace, instead of being aware of the disaster ahead, is taking its lead from
the Ruling Class. Alternatively, the American people are blithely swimming
in a sea of banalities and faux causes. Whether it is promoting
transgenderism, drowning in cults of personality, defacing and tearing down
statues, feverously looking for supposed racism under every rock, asserting
hypothetical compassion in the promotion of open borders and amnesty for untold
millions, breathlessly endorsing the false God of climate change, cheering for
their side of the political spectrum to humiliate the other, or demanding that
government make their lives better.
I will
not be among the 225 million Americans living today that will be alive in
2048. I have been fortunate to live throughout the golden age of
America’s power and influence, but regrettably to also see the impending end of
this glorious and short-lived era. The true tragedy is that those
225 million refuse to understand that for them there is no tomorrow to
disregard.
Read more: http://www.americanthinker.com/articles/2017/09/the_awful_future_that_looms_for_a_majority_of_todays_americans_.html#ixzz4tEUApC4L
Follow us: @AmericanThinker on Twitter | AmericanThinker on Facebook
Rural New York schools grapple with
declining population, increasing poverty
By Jason
Melanovski
20 September 2017
A recent report has highlighted the dire development of
increasing poverty and declining enrollment many rural school districts are
facing across New York state, forcing these districts to choose between making
onerous cuts, combining with other districts, or closing schools within the
district, thus forcing students to travel longer distances.
According to a report titled “Demographic Challenges Facing
Rural Schools: Declining Enrollment and Growing Poverty” by the New York State
Association of School Business Officials, the dual phenomena of increased
poverty and lower enrollment are wreaking havoc on local school budgets, which
are primarily funded by local property taxes.
Calling enrollment declines “omnipresent,” the report states
that “96.7 percent of rural school districts had declining enrollment and 84.9
percent had drops of at least ten percent.”
While the rate and overall population in poverty is still higher
in New York’s suburban and urban school districts, the poverty rate in rural
areas is increasing at a noticeably faster pace.
From 2003 to 2015, the poverty rate for school-age children
increased from 14 percent to 18 percent for children in rural school districts
and from 19 percent to 21 percent for children in non-rural school districts.
For both rural and non-rural school districts the greatest jump in poverty
rates occurred between 2009 and 2011 following the 2008 financial crisis.
Another measure of the economic plight of school children is the
percentage of children receiving free or reduced priced lunches. In rural
school districts 48.3 percent of students receive free or reduced priced
lunches, and that number rises to 53.2 percent of students in non-rural
districts. A student is eligible for free or reduced priced lunch when his or
her family makes less than 185 percent of the poverty level.
Although the report was released to shed light on the challenges
facing rural school districts, it made clear that poverty among the state’s
school children has no geographic limits. According the report, “The
combination of poverty and Free- and Reduced-Price Lunch (FRPL) data show that
a little more than one in every five schoolchildren in New York lives in
poverty, while a little more than half of all school children face significant
economic constraints at home.”
The report compiled data from the 340 rural school districts,
which make up about half of those in New York State, but serve only a little
more than 11 percent of the students.
The report noted that the population losses and increases in
poverty cannot be separated from the financial crisis of 2008, stating “for a
few years prior to the onset of the Great Recession, growth rates in urban and
rural counties were closely related. Beginning in 2008, rural populations
entered a period of sustained decline, while urban populations continued to
grow, though their pace of growth slowed after 2011.”
According to United States Census data, the emptying of much of
rural America can be directly connected to the shrinking number of jobs in
non-metro areas, as the rural job market is now 4.26 percent smaller than it
was in 2008.
Speaking to the Daily Star of Oneonta, NY, the
rural Delaware Academy School District’s Superintendent Jason Thomson stated
that the current 47 percent of students who qualify for free or reduced price
meals is the “highest we’ve ever seen.”
In addition, many of the rural counties mentioned in the report
have also been hit hard by the opioid epidemic, claiming the lives of young
workers and reducing an already declining population. Tioga County, for
instance, lost up to 10 percent of its population between 2002 and 2016 and
averaged 16.7 opioid deaths from 2013 to 2015 according to New York state.
With rapidly declining enrollment, rural schools are forced to
count on smaller and smaller budgets with each succeeding school year,
resulting in cuts to classes, teachers, programs and extracurricular activities
and an overall sense of living in a world with scant opportunities for future
life.
As the report states, rural “schools may have to cut back on
valuable academic and enrichment opportunities, from Advanced Placement courses
to music and sports programs, when they no longer have the student numbers
needed for viability. Any potential reductions in college readiness preparation
are incredibly serious. Decreasing enrollment can also increase students’ sense
of isolation as there are literally fewer peers for them to interact with.”
To add to an already dire state of morale in rural schools,
despite the fact that poor rural schools often have significantly higher
graduation rates than poor urban schools, diplomas from rural schools are often
seen as “worthless” according to David Little, executive director of the New
York State Rural Schools Association. Poor rural schools in New York are simply
unable to afford the cost of offering advanced placement (AP) and college-level
coursework that is seen as necessary by college admissions officers.
For its part, the New York state government and the Andrew Cuomo
administration have failed to respond to the demographic and social declines in
rural school districts and increase state aid. The state continues to use a
formula created in 2008, prior to the financial crisis, which categorizes the
majority of rural schools as “average need.” If current demographic and poverty
data were used, the majority of rural schools would now be considered
“high-need,” requiring increased state aid.
Increasing rural poverty is not unique to New York. It has been
rising across the country after falling sharply over many decades to a record
low rate in 2000 of 13.4 percent. 16.7 percent of rural Americans lived in
poverty in 2015, compared to 13 percent in poverty within metropolitan areas,
according to the United States Census Bureau.
US Census report shows increasing
social inequality
By Eric
London
15 September 2017
US Census data from 2016 released on Tuesday shows increasing
social inequality amid a small gain in household income that is offset by a
massive growth of personal debt and rising living costs.
The data tracks the ongoing redistribution of wealth from the
working class to the wealthy as a result of the pro-Wall Street policies of
both the Republican and Democratic parties. It substantiates the oligarchic
character of the United States.
Social
inequality
The Gini index, used to measure social inequality, with higher
figures indicating a wider economic divide, rose slightly from 2015 (.479) to
2016 (.481). The 2016 figure, according to rankings in the CIA World
Factbook, makes the US slightly more equal than Madagascar and less
equal than Mexico.
In terms of aggregate income share, the shift from 2015 to 2016
is as follows:
The growth in inequality is even starker when traced from 2007,
the year before the Wall Street crisis.
The data reflects income and not wealth, thereby providing an
incomplete and conservative indication of the scale of inequality. Even within
the highest quintile, the income share increased only for the top 10 percent,
and, in particular, the top 5 percent.
Household
income
The corporate media has portrayed the report as a sign of
positive income growth, since it shows a slight rise in median income of 3.2
percent from 2015 to 2016.
But according to the Census data, the earnings of “full-time,
year-round workers” remained stagnant. For men in this category, a total of
63.9 million people, earnings declined by 0.4 percent, from $51,859 in 2015 to
$51,640 in 2016. For women in this category, 47.2 million people, there was a
minor increase, 0.7 percent, from $41,257 in 2015 to $41,554 in 2016. In other
words, families with 2 adults working full-time saw a paltry $78 increase in
their yearly earnings from 2015 to 2016.
Claims of rising incomes mask the growth of inequality. The
Census data shows that the household income of the 90th percentile (the 100th
being the highest) was 12.53 times higher than the household income of the 10th
percentile in 2016, up from 12.23 times higher in 2015 and 11.18 times higher
in 2007. The degree to which income is concentrated in the richest 10 percent
of the population is exemplified by the fact that the 5th percentile boasted a
household income 3.82 times higher than the 50th percentile in 2016, up from
3.79 times in 2015 and 3.52 in 2007.
As Bloomberg News reported Wednesday, “Since 2007, average
inflation-adjusted income has climbed more than 10 percent for households in
the highest fifth of the earnings distribution, and it’s fallen 3.2 percent for
the bottom quintile. Incomes of the top 5 percent jumped 12.8 percent over the
period.”
For the working class, any income increase was transferred to
the corporate elite in the form of rising debt payments and increasing living
expenses, especially for health care.
According to figures from eHealth, a large private health
exchange, average deductibles for families rose 5 percent from 2016 to 2017 (a
year after the period covered by the Census report) and average individual premiums
rose 22 percent over the same period.
The rising cost of student debt alone largely erases income
increases seen by some young people. According to the Census, those aged 15 to
24 saw an income increase of 13.9 percent, from $36,564 in 2015 to $41,655 in
2016, while incomes for young people aged 25 to 34 rose 4.9 percent, from
$58,091 to $60,932, nearly double the percentage increase for older age groups.
However, in 2016, student debt rose to an average of $30,000 per
young person, up 4 percent from 2015, eliminating over 80 percent of the income
rise for 25-34 year olds. For 15 to 24 year olds, the $4,000 increase in median
income would hardly cover one sixth of the average debt payment, let alone make
up for the fact that young people face a future in which they are unlikely to
receive a pension, Social Security or Medicare.
Rising debt levels are not a phenomenon limited to young people.
A Bloomberg report
from August 10 notes that credit card defaults increased from the beginning of
2015—when roughly 2.5 percent of debt holders defaulted—to the end of 2016,
when the total hit 3 percent. This figure subsequently climbed in 2017 to reach
3.49 percent.
Bloomberg notes:
“After deleveraging in the aftermath of the last US recession, Americans have once
again taken on record debt loads that risk holding back the world’s largest
economy... Household debt outstanding--everything from mortgages to credit
cards to car loans--reached $12.7 trillion in the first quarter [2017],
surpassing the previous peak in 2008 before the effect of the housing market
collapse took its toll, Federal Reserve Bank of New York data show.”
“For most Americans,” the report continues, “whose median
household income, adjusted for inflation, is lower than it was at its peak in
1999, borrowing has been the answer to maintaining their standard of living.
The increase in debt helps explain why the economy’s main source of fuel is
providing less of a boost than in the past. Personal spending growth has
averaged 2.4 percent since the recession ended in 2009, less than the 3 percent
of the previous expansion and 4.3 percent from 1982-90.”
The Bloomberg report explains that
income from wages minus household debt trended downward in 2015, meaning that
debt is rising faster than wages, causing a loss of roughly $500 billion across
the US economy in the space of just one year.
Poverty
rate
Though the Census report shows that the poverty rate declined
from 13.5 percent of households in 2015 to 12.7 percent in 2016, this figure is
substantially higher than the 11.3 percent level that prevailed in 2000. In
reality, individuals and families must make 2.5 to 3 times the official poverty
rate of $12,000 for an individual, $15,500 for a married couple and $25,000 for
a family of four just to make ends meet.
What the data really shows is that the poorest half of the
country--over 150 million people--is in a desperate financial position, with
the next poorest 40 percent facing constant financial strain and a declining
share of the national income. In regard to poverty, the Census Bureau maintains
figures that go up only to 200 percent of the official poverty level. The
latest report shows that 95 million people—29.8 percent of the population—fall
into this category. The share of those under the age of 18 in this category is
much higher--39.1 percent.
This is the context for the drive by the Trump administration
and both big business parties to slash corporate taxes, impose a health care
“reform” that will increase costs for millions of people, and accelerate the
transfer of wealth from the working class to the financial aristocracy.
Census Bureau: Mens’ Wages Remain Below 1973 Levels
AP Photo/David Goldman
Americans’ median pay packets have been flat
since 1973, even though the vastly expanded federal government has justified
its own salaries and its many massive spending and policy programs as a
sure-fire way to boost education, productivity, and wages.
The colossal 44-year failure of the federal government to
help grow American men’s wages — or even to reduce poverty rates — is laid bare
in the latest report from the Census Bureau, “Income and Poverty in the United States: 2016.”
The dense report includes myriad detailed tables of data
around one shocking chart, which reveals no growth in men’s wages for the past
44 years, or since President Richard Nixon was beginning his second term in
office.
Median earning of full-time,
year-round workers, 15 years and older, 1960 to 2016.
The sudden flatline followed a 31 percent rise in all
men’s median wages from 1960 to 1972.
During the 44-year period since 1973, income among women
grew by roughly 30 percent as more skilled and trained women entered the
market, gained experience, and were promoted to better-paying jobs. Those
opportunities and contributions are good news — but they do not change the
reality that men’s income has been flat for 44 years.
In fact, the report notes that “the real median earnings
of full-time, year-round working men were 1.1 percent lower in 2016 than in
2007.”
There are many explanations for the flat income, such as
the massive growth in the labor supply when 30 million additional American
women and roughly 30 million immigrants joined in the marketplace competition
for good jobs. For example, a pro-immigration panel at the prestigious National
Academies of Science estimated in 2016 that the huge government-imposed
inflow of immigrants since 1965 has imposed a hidden 5
percent “immigration tax” on Americans’
pay packets.
Technology has made many individuals workers more
productive but also sidelined many others, such as newspaper printers and
steelworkers. Peaceful international trade has allowed men to sell more
products overseas but also allowed employers to hire foreign workers instead of
Americans. Whatever the combinations of reasons, the mid-point for men’s income
has been flat for 43 years, according to the Census Bureau.
The flat-earnings chart needs some explanation:
It shows only inflation-adjusted, pre-tax pay packets, so
it excludes the impact of inflation, taxes and government benefits, such as
food-stamps and tax-breaks for children, or of Obamacare’s subsidies and
spending obligations.
It shows median income, which is the midpoint of the
income scale. Half the people earn above the line, half the people earn below
the line. Average income would be higher, but less revealing, because a higher
share of income is going to the highest earners, compared to back in the 1970s.
The chart shows the income of year-round, full-time
workers, excluding part-workers or seasonal workers, or those who work
on-and-off under contracts. The chart does not make distinctions by race.
The chart shows individuals’ income, not the income
of households, which has fluctuated as the average number of children or adults
has declined.
The chart only shows income, but not the quality of goods
in the stores, such as Starbucks coffee, cheap products imported from China,
high-tech music players, improved autos or better health-care. That rise in
product quality from competing companies — not claimed policy improvements from
federal agencies — has provided the vast majority of material gains for
Americans amid flat incomes.
The median earnings for all men employed year-round was
$51,640 in 2016, which is still far below the $54,030 earned by full-time men
in 1973. It is also below the $51,938 earned in the 2000 Internet boom, or the
$52,222 earned in the 2007 property bubble when large-scale legal and illegal
immigration provided employers with millions of alternative imported workers.
The post-1973 reality of flat income is a huge contrast to
the rapid growth from 1960 up to the 1973 oil shock and the reopened inflow of
immigrant labor after 1965. During the twelves years 1960 to 1972, the
median average wages for all males — including minorities, seasonal workers,
and contract workers — rose from by 31 percent, from $31,926 to $41,013.
When the income of all men is gauged, the Bureau concluded
that all men’s median income in 1973 was $41,935. It dropped after 1973 and
rose back up to $43,360 in 1999 as companies competed for the few unemployed
workers during the first Internet boom. Income crashed in 2008 to a
depression-low of $39,636 in 2012 once the federal government’s real-estate
bubble burst. Since then, income has slowly climbed back to $42,220 in 2016
amid the continuous public protest against the federal government’s cheap-labor
economic strategy, which is exemplified by the bipartisan 2013 “Gang of Eight”
amnesty legislation.
Other data in the report shows that the nation’s poverty
rates have barely budged since the 1960s, although many people in the United
States are wealthier than many people n Europe. For example, the
percentage of American said to be in poverty was 11.1 percent in 1973 and 12.7
percent in 2016.
That national poverty rate climbed, in part, because of
the population of Latinos spiked from 10.8 million in 1973 to 57.6 million in
2016. Poverty among Latinos was 19 percent in 2016, little changed from
1973.
The report also noted that:
The official poverty rate decreased by 0.8 percentage
points between 2015 and 2016. At 12.7 percent, the 2016 poverty rate is not
statistically different from 2007 (12.5 percent), the year before the most
recent recession.
In real terms, median earnings of full-time, year-round
working women in 2016 were 2.3 percent higher than their 2007 median, the year
before the most recent recession. The real median earnings of full-time,
year-round working men were 1.1 percent lower in 2016 than in 2007.
In 2017, the number and percentage of shared households
remained higher than in 2007, the year before the most recent recession. In
2007, 17.0 percent of all households were shared households, totaling 19.7
million households. In 2017, 19.4 percent of all households were shared
households, totaling 24.6 million households.
OBAMA-CLINTONOMICS
to serve the filthy rich
The same period
has seen a massive growth of social inequality, with income and wealth concentrated
at the very top of American society to an extent not seen since the 1920s.
“This
study follows reports released over the past several months documenting rising
mortality rates among US workers due to drug addiction and suicide, high rates
of infant mortality, an overall leveling off of life expectancy, and a growing
gap between the life expectancy of the bottom rung of income earners compared
to those at the top.”
A 'Read-My-Lips'
Moment for Trump?
President Donald J. Trump
participates a Hurricane Irma briefing call with FEMA Administrator William
"Brock" Long, Monday, Sept. 11, 2017, joined by White House Chief of
Staff Gen. John Kelly, left; Homeland Security and Counter Terrorism Adviser
Thomas Bossert, right, and Deputy Homeland Security Adviser John J. Daly,
seated, in the Oval Office at the White House in Washington, D.C. ( Official
White House Photo by Shealah Craighead)
"Having cut a deal with Democrats for help with the debt
ceiling, will Trump seek a deal with Democrats on amnesty for the 'Dreamers' in
return for funding for border security?"
The answer to that question, raised in my column a week ago, is
in. Last night, President Donald Trump cut a deal with "Chuck and
Nancy" for amnesty for 800,000 recipients of the Deferred Action for
Childhood Arrivals program who came here illegally as youngsters, in return for
Democratic votes for more money for border security.
According to preening Minority Leader Pelosi, the agreement
contains not a dime for Trump's Wall, and the "Dreamers" are to be
put on a long glide "path to U.S. citizenship."
Trump denies this is amnesty, and says the Wall comes later.
Fallout? Among the most enthusiastic of
Trump backers, disbelief, disillusionment
and wonderment at where we go from here.
Trump's debt-ceiling deal cut the legs out from under the GOP
budget hawks. But amnesty would pull the rug out from under all the folks at
those rallies who cheered Trump's promise to preserve the country they grew up
in from this endless Third World invasion.
For make no mistake. If amnesty is granted for the 800,000, that
will be but the first wave. "There are reasons no country has a rule
that if you sneak in as a minor you're a citizen," writes Mickey
Kaus, author of "The End of Equality," in The Washington Post.
"We'd be inviting the world. ... (An amnesty) would have a
knock-on effect. Under 'chain migration' rules established in 1965 ... new
citizens can bring in their siblings and adult children, who can bring in their
siblings and in-laws until whole villages have moved to the United States.
"(T)oday's 690,000 dreamers would quickly become millions
of newcomers who may well be low-skilled and who would almost certainly include
the parents who brought them — the ones who in theory are at fault."
Trump is risking a breach in the dam. If the populists who
provided him with decisive margins in Ohio, Wisconsin, Michigan and
Pennsylvania feel betrayed, it's hard to blame them.
Why did Trump do it? Clearly, he relished the cheers he got for
the debt ceiling deal and wanted another such victory. And with the rampant
accusations of a lack of "compassion" for his cancellation of the
temporary Obama administration amnesty, he decided he had had enough heat.
It is not easy to stand up for long to the gale force winds of
hostile commentary that blow constantly through this city.
Trump's capitulation, if that is what turns out to be, calls to
mind George H. W. Bush's decision in 1990 to raise the Reagan tax rates in a
deal engineered for him by a White House-Hill coalition, that made a mockery of
his "Read my lips! No new taxes!" pledge of 1988.
For agreeing to feed the beast of Big Government, rather than
cut its rations as Reagan sought to do, Bush was called a statesman.
By the fall of '92, the cheering had stopped.
Can Trump not know that those congratulating him for his
newfound flexibility will be rejoicing, should Bob Mueller indict his family
and his friends, and recommend his impeachment down the road?
What makes pre-emptive amnesty particularly disheartening is
that the Trump policy of securing the border and returning illegal immigrants
to their home countries appears, from a Census Bureau report this week, to be
precisely the prescription America needs.
In 2016, paychecks for U.S. households reached an average of
$59,039, up 3.2 percent from 2015, a year when they had surged.
U.S. median household income is now at its highest ever.
Yet there are inequalities. Where the median family income of Asian-Americans
is above $81,400, and more than $65,000 for white Americans, the median family
income of Hispanic families is $47,675, and that of African-American households
far less, $39,490.
Consider. Though black Americans are predominantly native-born,
while high percentages of Hispanics and Asians are immigrants, from the Census
numbers, Hispanics earn more and Asians enjoy twice the median family income of
blacks, which is below where it was in 2000.
Still, black America remains steadfastly loyal to a party that
supports the endless importation of workers who compete directly for jobs with
them and their families. Writes Kaus, "The median hourly wage (of DACA
recipients) is only $15.34, meaning that many are competing with hard-pressed,
lower-skilled Americans."
Looking closer at the Census Bureau figures, Trumpian economic
nationalism would appear to have its greatest appeal to the American working
class, a huge slice of which is native-born, black and Hispanic.
The elements of that policy?
Secure the border. Halt the invasion of low-wage workers, here
legally and illegally, from the Third World. Tighten the labor market to force
employers to raise wages in our full-employment economy. Provide tax incentives
to companies who site factories in the USA. Impose border taxes on the products
of companies who move plants abroad.
Put America and American workers first.
Will any amnesty of undocumented workers do that?
Patrick J. Buchanan is the author of a new book, "Nixon's
White House Wars: The Battles That Made and Broke a President and Divided
America Forever."
Poll: Huge Support for DREAM
Act-Border Security Compromise, 80 Percent Favor More Enforcement
|
Posted: Sep
27, 2017 10:25 AM
When President Trump canceled his predecessor's
legally-dubious 'DACA'
amnesty-by-fiat, he charged Congress with the task of resolving the issue
within six months. We know that Democrats, and some hardcore activists,
would prefer a "clean" bill that granted permanent deportation relief
to eligible DREAMers -- with no immigration enforcement provisions attached.
But Republican leaders have
made clear that
any DREAM Act-style legislation mustentail upgraded security elements,
with some key Democrats signaling that they might be open to a compromise.
Democrats' line in the sand is funding for "the wall," and the
White House appears prepared
to accommodate that
demand. In light of those facts, the
proposal I've floated involves drawing from the failed, Democrat-led 2013
'Gang of Eight' bill to identify immigration enforcement proposals that have
already gotten unanimous stamps of approval from Senate Democrats. Among
them are the hiring of thousands of new border agents, the construction of 700
miles of new fencing, and upgrading the e-verify system for hiring new
employees.
The idea, therefore, would be pretty straightforward: Law-abiding DREAMers' non-deportable status would be formalized and stabilized, while Americans concerned about border and internal immigration enforcement would see tangible progress on the security front. I argued that would be a fair deal, and would be broadly popular. A new Washington Post/ABC News poll confirms the latter piece of my analysis:
The idea, therefore, would be pretty straightforward: Law-abiding DREAMers' non-deportable status would be formalized and stabilized, while Americans concerned about border and internal immigration enforcement would see tangible progress on the security front. I argued that would be a fair deal, and would be broadly popular. A new Washington Post/ABC News poll confirms the latter piece of my analysis:
JUST
IN: New @ABC News/WaPo poll: 86% of Americans support DACA; 62% oppose proposed
border wall http://abcn.ws/2jWGpEe
Americans overwhelmingly support an equitable resolution for DREAMers, and by nearly a 40-point margin, they're willing to couple that legislative goal with "more border security." Stepping up efforts to require employers to verify a potential hire's immigration status is roughly an 80/20 issue. As you can see, Trump's proposals to "build the wall" and to slash legal immigration in half (easily the least popular component of the RAISE Act, other parts of which enjoy wide support) are underwater. Trump's smartest play would be to pick the most popular bits of the 'Gang of Eight's' enforcement provisions and make those his demands. If he gets a combination of increased border surveillance, new agents, hundreds of miles of fencing, and plus enhanced e-verify "in exchange for" treating the DREAMers "with heart," he could easily claim victory all around. He'd notch wins on improved security, and on building a border barrier (he could even call it "the wall") -- plus, he could frame any upgrades to the uber-popular e-verify system as protecting American workers. Those changes would reflect multiple commitments he repeatedly made on the campaign trail. Meanwhile, two Senate conservatives have introduced their version of the DREAM Act, which would offer an extended path to citizenship for up to 2.5 million potential DACA recipients:
[U]nlike other merit-based immigration proposals that
limit new immigrants from entering the country based on their job skills, this
proposal would limit who can remain in the country based on their years of
American education, work experience or military service…All applicants will
have to pass a medical examination and be “extreme vetted.” The vetting will include three
separate rounds of security and background checks to ensure they have no
criminal history and pose no national security threat. The first check would happen when the
immigrant enters the program followed by a second check after five years. The
third check comes after
15 years, if and when the immigrant applies to become a citizen…The proposal would grant high school
graduates without a serious criminal record conditional immigration status for
a five-year period. During that time, if they earn a higher-education degree,
serve in the military or stay employed, they could apply for permanent
residency and, eventually, citizenship.
Allahpundit
summarizes the
proposed vetting process: "You get five years of legal status to prove
that you can hold down a job, get your college degree, or enlist. Do one of the
three and you’re eligible for permanent residency. Keep your nose clean and, 10
years after that, you can become a citizen. That’s the Tillis/Lankford
timeframe, anyway; Democrats will insist on something more accelerated. I
assume we’ll end up with an eight- to 10-year citizenship path if this were to
become law," he writes. One thing that's nowhere to be found
in the Tillis/Lankford plan? New border security measures, though its
co-sponsors say those are essential:
Tillis said it was clear that the Dream Act did not have
enough support to pass the Senate and the House. Lankford said the Succeed Act is not
a standalone bill and would require companion legislation, particularly around
border security. Lankford said Trump “was very supportive of the concept” of the
legislation. That’s
a non-starter for some immigration activists. “We demand that Paul Ryan and
Mitch McConnell immediately allow for a vote on a clean Dream Act, without trying to use us as
bargaining chips for more money for out-of-control border control and
immigration enforcement,” said Make the Road New York.
Well, "immigration activists" don't control the
US Congress, do they? Their so-called 'demands' should be ignored.
For conservatives to even consider a plan like the one put forth by
Tillis and Lankford, simultaneous enforcement is a pre-requisite. A
failure to address and mitigate the problem of illegal immigration would and
should be the true "non-starter" in this negotiation.
|
|
Posted: Sep 07, 2017 5:45 PM
To all #DREAMers: You are welcome in the City of Chicago. This is your home. Come to
school and pursue your dreams. #DACA#ChicagoisOne
Chicago Mayor Rahm Emanuel
(D) said Tuesday that the Windy City will continue to welcome
"Dreamers" despite President Trump’s decision to rescind the
Deferred Action for Childhood Arrivals (DACA) program.
“To all the Dreamers that are
here in this room, and in the city of Chicago, you are welcomed in the city
of Chicago. This is your home and you have nothing to worry about,” Emanuel
said in a prepared statement.
The comments come just hours
after Attorney General Jeff Sessions announced that the DACA program, which
deferred deportation for undocumented immigrants who were brought to the
United States as minors and allows them to apply for work permits, would be
phased out.
“Chicago, our schools, our
neighborhoods, our city, as it relates to what President Trump said, will
be a Trump-free zone. You have nothing to worry about,” Emanuel continued.
This announcement comes after
the Trump White House decided to gradually phase out the Deferred Action
for Childhood Arrivals program. The Obama-era program has been
constitutionally questionable since then-President Obama announced it as a
stopgap measure. Now, around 800,000 illegal aliens benefit from the
program that shields them from deportation if they met certain
requirements. DACA recipients are illegal aliens that were minors when they
entered the country illegally. The decision to nix the program and place it
in Congress’ hands, which should have happened in the first place, has the
Left going insane.
Los Zetas Cartel Stockpiling Weapons near Texas Border
Fuerza Coahuila
CIUDAD
ACUNA, Coahuila — Members of the Los Zetas cartel continue their efforts to
stockpile weapons near the Texas border. In the most recent failed attempt,
authorities seized numerous assault rifles and body armor.
Officials made the seizure when members of the cartel hunting
police unit Fuerza Coahuila found a weapons cache hidden along a dirt road
by the waters of the Rio Grande border with Texas. Ciudad Acuña is
immediately south of Del Rio, Texas, and is a known drug and human
smuggling corridor originally used by the Los Zetas drug cartel. It is
currently used by their offshoot faction the Cartel Del Noreste (CDN).
The state police found the cache after conducting an intense
series of intelligence-driven operations in an attempt to locate various hideouts
used by CDN gunmen. Inside the weapons cache, authorities found several
sets of body armor with the Z/ CDN logo painted on them, four .308 caliber FAL rifles, two
AK-47 rifles, more than 800 rounds of ammunition, and radio communications
equipment.
In July, the Mexican military in Nuevo Laredo, Tamaulipas,
seized a massive weapons
cache at a cartel stash house in that border city, Breitbart Texas reported. As part of the weapons cache,
authorities seized numerous Russian-made RPG’s, grenade launchers, .50
caliber rifles, and dozens of assault rifles. Nuevo Laredo is another
border city that is controlled by the CDN faction of Los Zetas cartel.
Editor’s Note: Breitbart Texas traveled to the Mexican States
of Tamaulipas, Coahuila, and Nuevo León to recruit citizen journalists
willing to risk their lives and expose the cartels silencing their
communities. The writers would face certain death at the hands of the
various cartels that operate in those areas including the Gulf Cartel and
Los Zetas if a pseudonym were not used. Breitbart Texas’
Cartel Chronicles are published in both
English and in their original Spanish. This article was written by “J.M. Martinez” from
Coahuila.
|
No comments:
Post a Comment