Inequality and the crisis of American democracy
20 August 2018
On Thursday, the Economic Policy Institute reported that average CEO pay at America’s 350 largest companies grew by 17.6 percent between 2016 and 2017. The typical chief executive received $18.9 million in compensation. The wage of a typical US worker, on the other hand, grew by a negligible 0.3 percent.
The typical CEO in the US now makes 312 times what the average worker makes, up from the 20-to-1 ratio that prevailed in the 1960s. This means that, on average, a CEOs earns in a single day almost as much as the average worker makes in an entire year.
Ten years after the Bush and Obama administrations carried out the largest bank bailout in human history in response to the 2008 financial crisis, every indicator of social inequality is soaring.
In 2008, the 400 wealthiest people in America had a net worth of $1.5 trillion. This figure has since doubled, standing at close to $3 trillion.
Ten years ago, the net worth of Jeff Bezos, the CEO of Amazon, was $8.7 billion. Now, it stands at $140 billion, a 16-fold increase. Facebook CEO Mark Zuckerberg had a net worth of $1.5 billion at the time of the financial crisis. His wealth now stands at $69 billion, a 46-fold increase.
Not only have the individuals whose crimes triggered the financial crisis avoided going to jail, they have become vastly more wealthy. JPMorgan Chase CEO Jamie Dimon and former Goldman Sachs CEO Lloyd Blankfein have both become billionaires over the past decade, despite playing key roles in creating the mortgage-backed securities bubble then profiting by betting on its collapse.
In the ninth year of the supposed economic recovery, in which the economy is nominally approaching full employment, with the tightest job market in decades, wages continue to fall year after year. Over the past 12 months, wages fell 0.2 percent in real terms, while stock prices shot up by 12 percent.
When the capitalist media write on the persistent fall in wages amid soaring profits, they scratch their heads in bewilderment as to why the vaunted mechanism of the “free market,” with its mantra that “a rising tide lifts all boats,” has broken down. But in ruling circles it is an open secret that the growth of social inequality was the desired outcome of the financial bubble, the crash and the bailout.
In the run-up to the financial crisis, Democratic and Republican administrations alike, together with the banking regulators, encouraged the creation of one financial bubble after another. After the crash, none of those responsible were criminally charged, all of the banks’ bad bets were recouped with public funds, and the Federal Reserve and Obama administration encouraged the creation of another massive financial bubble to enrich the ruling elite at the expense of the working population.
The historically unprecedented levels of social inequality are incompatible with democratic forms of rule. More than a decade ago, responding to the stolen 2000 election and the ripping up of democratic rights in the name of the “war on terror,” the World Socialist Web Site explained that underlying the destruction of democratic rights was the growth of social inequality.
In a 2006 lecture, WSWS International Editorial Board Chairperson David North noted:
American society is deeply fractured. The level of social polarization has assumed explosive dimensions. Those in the top five or top one percent of society in terms of income and wealth have no deep commitment to democratic rights. Of course, there are exceptions to be found within this social category. But the objective relation of the wealthiest strata of society to democracy is of an entirely different character than that of the broad masses. For the ruling elite, democracy is something of a convenience, not a necessity. As has been demonstrated all too often in the 20th century, dictatorship serves to protect wealth, not to threaten it.
In the period following the 2008 crash, these processes have only accelerated. In 2010, the Obama administration asserted the right to kill American citizens with drone missile strikes, even within the United States, and murdered two American citizens without trial overseas to prove the point.
Whistleblower Edward Snowden showed that the US intelligence agencies are spying on the American people on a scale that makes Richard Nixon’s plumbers look like amateurs. He was forced into exile in Russia. Journalist Julian Assange, who documented war crimes and conspiracies against democracy, was, and remains, effectively imprisoned in London at the demand of US authorities.
Most ominously of all, the major technology companies are, at the behest of the US intelligence agencies and leading figures within the political establishment, implementing a regime of Internet censorship unprecedented in scope and scale.
Now the crisis of American democracy has entered a new stage. Donald Trump, who embodies the corruption and criminality of the capitalist ruling elite, is creating an ever-more openly authoritarian government, resting on appeals to his fascistic base.
But there is not the slightest democratic content in the opposition to Trump from within the state and ruling class. Figures like former CIA Director John Brennan and former Director of National Intelligence James Clapper express the direct intervention of the state intelligence agencies—responsible for countless crimes against the American and international working class—into political life, with the support of the Democratic Party and the media.
More and more, sections of the media and ruling elite are using language that implies support for a military coup. On Friday, the New York Times ran an op-ed by author Tim Weiner all but calling for a mutiny by the military and intelligence bureaucracy.
He wrote:
John Brennan, who knows whereof he speaks, believes that the president is a threat to the security of the United States—a counterintelligence threat, no less, in thrall to President Vladimir Putin of Russia … They are sending a message to active-duty generals and admirals, soldiers and spies. Remember your oath to protect and defend the Constitution against all enemies, foreign and domestic. Think twice before following [Trump’s] orders in a crisis.
Both factions of the ruling class, despite their mutual mud-slinging, represent right-wing, authoritarian political tendencies.
These representatives of the capitalist oligarchy must be opposed through the methods of the class struggle—that is, the conscious, independent intervention of the working class into political life. All over the world, workers are entering into struggle, from UPS workers in the United States to Ryanair pilots and cabin crew in Europe. Poll after poll shows growing support for socialism among workers and young people.
The struggle to arm this growing movement of the working class with a socialist perspective is the only means for defending democratic rights, which can be secured only by ending the capitalist system—the source of inequality, war and authoritarianism.
Andre Damon
ttps://www.city-journal.org/html/private-and-public-sector-debt-crises-16115.htm?utm_source=City+Journal+Update&utm_campaign=bc07cccaa0-
August 16, 2018
Economy, finance, and budgets
In June,
American credit-card debt reached an all-time high of $1.04 trillion. Forty-one percent of
Americans carry such debt, according to the ValuePenguin financial-research
group, meaning that they can’t meet their basic expenses without borrowing,
regularly, at an average interest rate of 17 percent. The upper-middle-class
and poor alike carry such debt, though the poorer you are, the more you’re
likely to owe, as a percentage of income. But average income
isn’t the only way to tally credit-card debt. Age matters, too, and the rising
age of credit-card debtors should concern anyone worried about entitlement
spending, America’s potential public-debt crisis-in-waiting.
Two
decades ago, the mythical credit-card borrower was a heedless college student
throwing money away on spring break; now, it’s just as often grandma buying
groceries. A new report, “Graying of U.S. Bankruptcy,” is grim. “Older
Americans are increasingly likely to file consumer bankruptcy, and their
representation among those in bankruptcy has never been higher,” note Deborah
Thorne, Pamela Foohey, Robert M. Lawless, and Katherine Porter, all professors
of law or sociology. According to data culled from the Consumer Bankruptcy
Project and from household surveys, Americans age 65 and older are filing for
bankruptcy at rates two and three times higher than in 1991, even as young
people file less frequently. “The bankruptcy trend . . . is so robust that the
broader trend of an aging U.S. population can explain only a small portion of
what is happening,” the authors note.
Today,
one in seven bankrupt households involves someone 65 or over, nearly a
five-fold increase in 25 years. Among the oldest Americans—75 and older—“there
has been a near ten-fold increase since 1991,” from 0.3 percent to 3.3 percent
of filers. Out of 800,000 annual household bankruptcy filings, 97,600, or 12.2
percent, come from older householders. The reason for more bankruptcies is
hardly shocking: too many people are not ready for retirement. It’s true that,
on average, people may overestimate their need for retirement income. As Andrew
Biggs, an expert on the topic at the American Enterprise Institute, observes, “78 percent of current
retirees tell Gallup they have sufficient
money to live comfortably,” and retirement income is expected to rise in future
years, from a median of $37,887 in 2015 to a median of $42,165 by 2035. Very
few retirees—6.7 percent—live in poverty.
Still,
averages aren’t everything, and of the 51 percent of people 60 and older who
think their retirement savings are inadequate, according to a recent Federal
Reserve survey, many of them are right.
Many older people either voluntarily retire or lose their jobs without having
saved enough to maintain their living standards. These problems are exacerbated
by sudden shocks—big medical bills not covered by Medicare, for example. A
younger person who loses a job has a good chance of getting another; an older
person often cannot. “Being 67 and having back problems, not many people will
hire you,” said one Consumer Bankruptcy Project participant.
Older
bankruptcy filers are, generally speaking, not people who spent their working
lives in poverty or profligacy. Filers don’t take bankruptcy lightly: 66
percent struggled for at least two years to manage their debt before giving up.
Consistent with Biggs’s data, they are not even living in poverty in
retirement. Two-thirds of them own their own homes, far greater than the 41
percent of younger bankruptcy filers. Older bankruptcy filers report about
$30,600 in annual income, compared with $38,100 for their younger counterparts,
consistent, again, with Biggs’s data on retirees’ relative income stability.
The official poverty threshold for a family of
four is $24,900. Most older families are smaller, with more modest needs, than
families with children; they don’t need money to commute to work, pay for
daycare, buy fresh clothing every year, or frequently replace their
home-computer technology or cars.
No, the
bankrupt elderly are people accustomed to maintaining at least a modest
middle-income lifestyle—and whether hit with a shock or gradually falling
behind, they are unable or unwilling to cut their expenses to meet the new
realities. Nor do the bankrupt elderly bear the hallmarks of people who lived
lives of chronic financial irresponsibility during their younger years.
Paradoxically, bankruptcy itself is a sign of responsible long-term planning:
it costs money, with the average personal bankruptcy requiring $1,300, and
requires gathering paperwork, working with an attorney, and planning for the
future, all indicators of competence. A less responsible person would simply
ignore his creditors, particularly since credit-card and other unsecured debts
aren’t transferred to heirs upon the death of a borrower.
Rather,
what’s driving elderly bankruptcy is the use of debt as a replacement for
income. Older bankruptcy filers owe $101,600, including $32,700 of unsecured
debt (credit cards, medical bills, and the like). Credit-card debt among the
elderly, in particular, is a new phenomenon. A separate study this year, by
the Employee Benefit Research Institute, found that 42 percent
of families age 65 to74 have outstanding credit-card debt, up sharply from 29
percent in 1998. Among people 75 and older, the figure is 26 percent, up from
11 percent in 1998. The average credit-card debtor between the ages of 65 and
69 owes $6,876, according to ValuePenguin—substantially more than an adult below the
age of 35, who owes $5,808.
From the
perspective of financial prudence, this gets it exactly backwards. A member of
Generation Z (the cohort following the millennials) has decades to pay off her
debt. It may be understandable that, in the course of getting started as an
adult, she has to borrow money for a period of time before her income catches
up to these starting-out-in-life costs. For a much older person, those big
purchases are largely in the past, and the chances of ever catching up with
such borrowing are slim, actuarially speaking.
Of
course, the vast majority of elderly people are not in bankruptcy; 97,600 each
year is still a small number. Yet the very existence of such debt among people
over 65 is a sign of stress. Indeed, the plight of older America collides
directly with the challenge of ballooning entitlement spending. With spending
on Social Security and Medicare set to rise from 8 percent of GDP this year to
10 percent by 2028, exacerbating multi-trillion-dollar budget
deficits, almost every mainstream proposal to pare the federal budget involves
cuts to these programs. But sensible-sounding solutions—such as raising the
Medicare-eligibility agefrom 65 to 67 or accelerating existing increases in
Social Security’s full retirement age from a soon-to-be
67 to 70—would hit many elderly people hard, and not just the financially
stressed.
As Biggs
notes, the fact that the average household spends just $7,300 cumulatively on
long-term care during retirement—thus likely keeping bankruptcy rates down—is
largely due to Medicare and Medicaid. These costs aren’t a matter of concern to
retirees themselves, he says, but rather to “states and federal governments,
which foot most of the bill.” Shifting more of that bill toward households
would cause more strain. As for Social Security, of the nearly 3 million people
who started to receive benefits in 2017, nearly 1.6 million were under age 66,
though such workers face a significant penalty for taking this “early
retirement.” People who opt to incur this penalty aren’t irrational; they
simply need the money.
As
America grapples with its public-sector debt burden, driven in part by spending
on retirees, it should heed a sign from the private-sector debt market: too
many middle-class retiree families already have little room for financial or
fiscal change. The longer the country waits to act on solutions—including on
cutting health-care delivery costs—the sharper a future shock could prove to be.
August
11, 2018
Are Millennials Educable?
Picture
ten-year-old Johnny, his masculinity threatened on every level, his mental and
physical energy denied expression, his home life hectic and unsupportive, his
continued inability to read becoming more debilitating every year, and his
boredom level off any available chart. Imagine being
him. We know that his disadvantages will not be met in
5th grade any more than they were in 1st. We know – looking at
the recent educational studies – that in seven years, he will graduate, in much
the same condition, if he graduates at all. Given the odd assumption
that graduation proves effective education, and the pressure schools are under
to up graduation numbers, he probably will walk away with a diploma, but it
will be meaningless.
We
know that the graduation rate and the proficiency levels no longer correlate at
all. Over 80%
of our high school seniors "earn" diplomas, but 37% of
them can read at grade level. Twenty-five
percent of them can do math at grade level. And yet our
schools are more concerned about programming young people for sexual deviancy
and multicultural hatred of their own country than they are in turning out
thinking, informed, skilled adults.
Why
can't our schools fix this problem? There are many answers –
teachers' unions, left-leaning educational institutions, leftist textbooks,
etc. But our schools are filled with wonderful teachers working
appalling hours and wanting desperately to see their students
learn. What is in their way? How is it these kids can get
all the way through 13 years of schooling and know nothing?
Look
back at Johnny. In first grade, he didn't learn to read, but what
happened to him? He went on to 2nd grade, where he had even less
opportunity to figure it out. But did he stay in 2nd grade or a
remedial class until he caught on? No. On to
3rd, where his dismal scores on standardized tests demonstrate clearly his
inabilities, but still nothing will be done.
One
year, during my tenure as a high school English teacher, we were required to
attend evening classes instructing us in how to teach our students to read – in
addition to everything else we were supposed to be inculcating. The
lessons in these classes were all geared to 3rd grade, which bothered us
all – if this approach didn't work when these kids were eight-year-olds, why
would it work when they're 17? I asked about the viability of this
approach for high school, and the instructor admitted that they had no idea how
to rescue a teenager who had never mastered reading.
Fifty
years ago, schools quit holding Johnny back a grade when he didn't reach the
set standards. Administrators deemed it too rough on his ego to
admit his problem and fix it. We would damage his self-esteem, and
we heard over and over again that the self-esteem deficit would render any
increase in skill null and void. No one ever proved that, but say
something often enough, and it becomes gospel. No one considered
what damage Johnny's ego would sustain in high school when reading and writing
and computing skills were both assumed and necessary.
Once
the schools cannot hold kids back because they haven't mastered reading and
math, then subsequent teachers are under pressure – political, professional,
and pragmatic – to keep the momentum going.
Some
dumbing down has to happen if a teacher has a classroom full of students below
grade level. There is nothing to be gained by failing them
all. And as teachers, we are taught to meet our students where they
actually are. That is good pedagogy.
However,
if an instructor's students don't meet the standard, the teacher gets in
trouble, the students become demoralized, and the parents get
angry. Angry parents make for nervous and defensive administrators
who, in turn, pressure the teachers into – what? Passing the
students whether they've cleared the hurdles or not.
This
continues until high school when the problem just blows up. Unless
the district chooses to do what my district did: we "raised the
bar." You've got to love educational jargon. We did
this by:
1.
Cutting out the "D" as a grade option – which merely inflated the
grades.
2.
Demanding that students turn in all assignments. I
know: this doesn't seem out of line, but most students miss an assignment now
and then, and no one could see that a do-or-die turn-in policy only erased the
ability to insist on due dates. We couldn't legally fail a kid for
being late on an assignment. One of my students said to me one day,
"Ah, due dates, schmue dates." Kids were turning in papers
months late, and we had to accept them.
3.
Forcing kids into honors-level classes whether they are capable or
not. And then when too many began failing, the administration
demanded that teachers dumb down the curricula. Then the following
year, students were assigned to the next level up, and they weren't ready to do
the work, because the previous curricula had been so
simplified. That was "raising the bar."
Then
these kids go off to college, and the colleges face the same
problems. I'd like very much to increase the rigor of the college
classes I teach – in spite of the fact that transfer students find my classes
much more rigorous than their state junior college classes have
been. But if I really expected kids to actually function at what we
used to call "college" level, they'd fail. It's
mind-boggling, and frustrating, and knowing where it came from is not much
help.
It's
not as if we don't know what can be done about it. In the last
couple of decades, brain research has taught us quite a bit about how the brain
learns. We know that the more background knowledge a child has,
the better
a reader he will be – yet we spend most of the school day drilling kids on
"reading skills" rather than teaching them anything
factual. We know that movement plays a big role in brain
development, yet we cut back on recess. We know music and art
improve brain function, but we cut art.
We
must remember that the original purpose of John Dewey's educational scheme
never was to produce thinking, critical, knowledgeable human
beings. It was to create drones. We have succeeded in
that.
Plus,
the society in general discourages facing ugly truths and makes pretending
fairly easy for a long period of time, but here in 2018, it's clear that the
make-believe fairy tale is over. Millennials are finding that they
are tens of thousands of dollars in debt, yet they know little that is actually
true. They have learned attitudes but not facts. We've
hit that wall.
What
does public education do? Nothing. I've been involved,
either willingly or otherwise, in half a dozen educational reforms designed to
fix our problems. They all fail. The solution lies
outside the auspices of government and teacher unions. The
responsibility for educating our young has to start with the
family. It can easily blossom into private enterprise, charter
schools, and school vouchers. The homeschooling industry is
thriving, and so are the students educated at home.
For
the last nine years, I've been involved in building a school, a Bible-based
junior college. Accreditation took us that long, and raising money
isn't easy, but it can be done. We can crawl out from under the
crushing weight of a system devoid of reality. We just have to
begin.
Deana Chadwell blogs at www.ASingleWindow.com. She is also
an adjunct professor and department head at Pacific Bible College in southern
Oregon. She teaches writing and public speaking.
SENIORS HEAD TO BANKRUPTCY COURTS
New in GOP logic: Antipoverty programs worked
so well, we must get rid of them
More than
50,000 UC workers on strike
For a political
movement of the entire working class against inequality and capitalism!
By David Moore
Viking
Economics by George Lakey
by Melville House
Graph by Alberto Mena
Graph by Alberto Mena
Why does the U.S. have such an outlier child poverty rate?
Our immigration system has a lot to do with it
http://www.latimes.com/opinion/op-ed/la-oe-hymowitz-child-poverty-immigration-20171029-story.html
More than 52
million Americans live in economically distressed communities
By Sandy English
The Awful
Future that Looms for a Majority of Today’s Americans
Rural New York
schools grapple with declining population, increasing poverty
By Jason Melanovski
US Census report
shows increasing social inequality
By Eric London
Social
inequality
Household
income
Poverty
rate
Census
Bureau: Mens’ Wages Remain Below 1973 Levels
Americans’ median pay packets have
been flat since 1973, even though the vastly expanded federal government has
justified its own salaries and its many massive spending and policy
programs as a sure-fire way to boost education, productivity, and wages.
A
'Read-My-Lips' Moment for Trump?
Trump backers, disbelief, disillusionment
and wonderment at where we go from here.
ttps://www.city-journal.org/html/private-and-public-sector-debt-crises-16115.htm?utm_source=City+Journal+Update&utm_campaign=bc07cccaa0-
August 16, 2018
Economy, finance, and budgets
In June,
American credit-card debt reached an all-time high of $1.04 trillion. Forty-one percent of
Americans carry such debt, according to the ValuePenguin financial-research
group, meaning that they can’t meet their basic expenses without borrowing,
regularly, at an average interest rate of 17 percent. The upper-middle-class
and poor alike carry such debt, though the poorer you are, the more you’re
likely to owe, as a percentage of income. But average income
isn’t the only way to tally credit-card debt. Age matters, too, and the rising
age of credit-card debtors should concern anyone worried about entitlement
spending, America’s potential public-debt crisis-in-waiting.
Two
decades ago, the mythical credit-card borrower was a heedless college student
throwing money away on spring break; now, it’s just as often grandma buying
groceries. A new report, “Graying of U.S. Bankruptcy,” is grim. “Older
Americans are increasingly likely to file consumer bankruptcy, and their
representation among those in bankruptcy has never been higher,” note Deborah
Thorne, Pamela Foohey, Robert M. Lawless, and Katherine Porter, all professors
of law or sociology. According to data culled from the Consumer Bankruptcy
Project and from household surveys, Americans age 65 and older are filing for
bankruptcy at rates two and three times higher than in 1991, even as young
people file less frequently. “The bankruptcy trend . . . is so robust that the
broader trend of an aging U.S. population can explain only a small portion of
what is happening,” the authors note.
Today,
one in seven bankrupt households involves someone 65 or over, nearly a
five-fold increase in 25 years. Among the oldest Americans—75 and older—“there
has been a near ten-fold increase since 1991,” from 0.3 percent to 3.3 percent
of filers. Out of 800,000 annual household bankruptcy filings, 97,600, or 12.2
percent, come from older householders. The reason for more bankruptcies is
hardly shocking: too many people are not ready for retirement. It’s true that,
on average, people may overestimate their need for retirement income. As Andrew
Biggs, an expert on the topic at the American Enterprise Institute, observes, “78 percent of current
retirees tell Gallup they have sufficient
money to live comfortably,” and retirement income is expected to rise in future
years, from a median of $37,887 in 2015 to a median of $42,165 by 2035. Very
few retirees—6.7 percent—live in poverty.
Still,
averages aren’t everything, and of the 51 percent of people 60 and older who
think their retirement savings are inadequate, according to a recent Federal
Reserve survey, many of them are right.
Many older people either voluntarily retire or lose their jobs without having
saved enough to maintain their living standards. These problems are exacerbated
by sudden shocks—big medical bills not covered by Medicare, for example. A
younger person who loses a job has a good chance of getting another; an older
person often cannot. “Being 67 and having back problems, not many people will
hire you,” said one Consumer Bankruptcy Project participant.
Older
bankruptcy filers are, generally speaking, not people who spent their working
lives in poverty or profligacy. Filers don’t take bankruptcy lightly: 66
percent struggled for at least two years to manage their debt before giving up.
Consistent with Biggs’s data, they are not even living in poverty in
retirement. Two-thirds of them own their own homes, far greater than the 41
percent of younger bankruptcy filers. Older bankruptcy filers report about
$30,600 in annual income, compared with $38,100 for their younger counterparts,
consistent, again, with Biggs’s data on retirees’ relative income stability.
The official poverty threshold for a family of
four is $24,900. Most older families are smaller, with more modest needs, than
families with children; they don’t need money to commute to work, pay for
daycare, buy fresh clothing every year, or frequently replace their
home-computer technology or cars.
No, the
bankrupt elderly are people accustomed to maintaining at least a modest
middle-income lifestyle—and whether hit with a shock or gradually falling
behind, they are unable or unwilling to cut their expenses to meet the new
realities. Nor do the bankrupt elderly bear the hallmarks of people who lived
lives of chronic financial irresponsibility during their younger years.
Paradoxically, bankruptcy itself is a sign of responsible long-term planning:
it costs money, with the average personal bankruptcy requiring $1,300, and
requires gathering paperwork, working with an attorney, and planning for the
future, all indicators of competence. A less responsible person would simply
ignore his creditors, particularly since credit-card and other unsecured debts
aren’t transferred to heirs upon the death of a borrower.
Rather,
what’s driving elderly bankruptcy is the use of debt as a replacement for
income. Older bankruptcy filers owe $101,600, including $32,700 of unsecured
debt (credit cards, medical bills, and the like). Credit-card debt among the
elderly, in particular, is a new phenomenon. A separate study this year, by
the Employee Benefit Research Institute, found that 42 percent
of families age 65 to74 have outstanding credit-card debt, up sharply from 29
percent in 1998. Among people 75 and older, the figure is 26 percent, up from
11 percent in 1998. The average credit-card debtor between the ages of 65 and
69 owes $6,876, according to ValuePenguin—substantially more than an adult below the
age of 35, who owes $5,808.
From the
perspective of financial prudence, this gets it exactly backwards. A member of
Generation Z (the cohort following the millennials) has decades to pay off her
debt. It may be understandable that, in the course of getting started as an
adult, she has to borrow money for a period of time before her income catches
up to these starting-out-in-life costs. For a much older person, those big
purchases are largely in the past, and the chances of ever catching up with
such borrowing are slim, actuarially speaking.
Of
course, the vast majority of elderly people are not in bankruptcy; 97,600 each
year is still a small number. Yet the very existence of such debt among people
over 65 is a sign of stress. Indeed, the plight of older America collides
directly with the challenge of ballooning entitlement spending. With spending
on Social Security and Medicare set to rise from 8 percent of GDP this year to
10 percent by 2028, exacerbating multi-trillion-dollar budget
deficits, almost every mainstream proposal to pare the federal budget involves
cuts to these programs. But sensible-sounding solutions—such as raising the
Medicare-eligibility agefrom 65 to 67 or accelerating existing increases in
Social Security’s full retirement age from a soon-to-be
67 to 70—would hit many elderly people hard, and not just the financially
stressed.
As Biggs
notes, the fact that the average household spends just $7,300 cumulatively on
long-term care during retirement—thus likely keeping bankruptcy rates down—is
largely due to Medicare and Medicaid. These costs aren’t a matter of concern to
retirees themselves, he says, but rather to “states and federal governments,
which foot most of the bill.” Shifting more of that bill toward households
would cause more strain. As for Social Security, of the nearly 3 million people
who started to receive benefits in 2017, nearly 1.6 million were under age 66,
though such workers face a significant penalty for taking this “early
retirement.” People who opt to incur this penalty aren’t irrational; they
simply need the money.
As
America grapples with its public-sector debt burden, driven in part by spending
on retirees, it should heed a sign from the private-sector debt market: too
many middle-class retiree families already have little room for financial or
fiscal change. The longer the country waits to act on solutions—including on
cutting health-care delivery costs—the sharper a future shock could prove to be.
New in GOP logic: Antipoverty programs worked
so well, we must get rid of them
By SASHA ABRAMSKY
Demonstrators and homeless advocates rally in solidarity with
those experiencing homelessness and Disneyland workers struggling with poverty
wages outside the theme park in Anaheim, Calif. on July 14. (Los Angeles Times)
For many decades now the GOP has sought to undo the New Deal and
the Great Society. But a report released last month from the White House’s
Council of Economic Advisors, lost in a sea of grabbier news items, applies a
new logic to the goal of shredding the safety net.
According to “Expanding work
requirements in non-cash welfare programs,” comprehensive antipoverty programs
are no longer necessary because 50 years of antipoverty programs — yes, those
same interventions long hated, and their effectiveness belittled, by the GOP —
have succeeded so spectacularly that poverty is largely a thing of the past.
The report claims that the War
on Poverty led to “the success of the United States in reducing material
hardship,” but “that it also came at the cost of discouraging self-sufficiency.”
It proceeds to lay out a case for limiting access to benefits and setting in
place work requirements in exchange for basic nutritional and medical benefits.
This is beyond disingenuous.
Yes, in the years after 1964, when President Lyndon Johnson launched the War on
Poverty, the percentage of poor Americans did significantly decline; by some measures
it was cut in half from about 22% of the population down to about 11%. But over
the last 40 years it has rebounded with a vengeance.
Only a government stocked with billionaires
and reveling in its lack of empathy could conceivably claim that real poverty
no longer exists in the U.S.
Hunger is up again.
Homelessness is up again – though the report claims erroneously that,
“[f]ortunately, homelessness is rare in the United States.” The number of
casual and hourly laborers one accident or sickness away from a financial
disaster is up, the number of elderly Americans financially unable to retire is
increasing, and the proportion of the workforce with secure salaries and
guaranteed pensions is down.
Income inequality in today’s
America is as extreme as it has been at any point since the Gilded Age. In an
era of flamboyant affluence and dot.com billionaires, the Princeton sociologist
Kathryn Edin has found that at least 1.5 million Americans live on incomes of
under $2 a day.
In the downtowns of cities such
as Los Angeles, tens of thousands of homeless live on the streets. Meanwhile,
high-end homes in those same cities sell for tens of millions of dollars. All
of this and more was pointed out in the recent United Nations report on the
dangerous levels of extreme poverty and inequality in the United States.
Somewhere between one in six
and one in seven Americans live below the government’s own, extremely cautious
definition of the poverty line: less than $13,000 for a single person, just
over $25,000 for a family of four. That’s vastly higher than in most other
developed economies. Somewhere around one in five American kids live in
poverty, and in many counties that number surpasses one in four.
While reporting on American
poverty, I encountered people in New Mexico who lived without running water in
their homes. I met grandparents in Idaho standing for hours on food bank lines
so they could feed their grandchildren. I met Wal-Mart workers earning so
little they qualified for food stamps. I met a man in Pennsylvania bankrupted
by bills from his quadruple bypass heart surgery. I met schoolchildren in
Nevada who were homeless. I met day laborers working for far below the legal
minimum wage.
In Fresno and in Orange
counties, I’ve seen dozens crammed into two-bedroom houses. I have talked to
old men and women who have lost homes and cars to predatory payday lenders. A
couple of months ago, I interviewed the director of a medical clinic in
Oakland, most of whose clients were impoverished immigrants. She talked of a
poor patient so terrified of medical bills that he refused to go to the
hospital even after she told him that he was having a stroke right in front of
her.
Only a government stocked with
billionaires and reveling in its lack of empathy could conceivably claim that
real poverty no longer exists in the United States.
Trump’s ghastly regime is
seeking to shred the food stamp system, Medicaid and other vital benefits. It
is proposing to triple the
rent for large numbers of poor families who live in public housing. It is about
to unveil a new definition of “public charge” that would allow the
administration to deny permanent residency to any legal immigrant who uses, or
whose children use, food stamps, public health systems, low-income heating
assistance or other vital programs. And it is aggressively pushing to impose
onerous work requirements for benefits, not because the country is genuinely
strapped for cash, but because, abetted by a far-right Congress, they have
handed out hundreds of billions of dollars in tax cuts to the wealthiest among
us and are now looking for a way to pay the bill.
All of this is guaranteed to
exacerbate the country’s already stark income divides, and to make the quality
of life for America’s least fortunate even worse.
I wonder how President Trump,
Ben Carson, Steven Mnuchin, Jared Kushner, and the other architects of
America’s war on the poor would cope were they to try to live on $2 a day.
Something tells me that these
pampered princelings would then quickly find that poverty is indeed something
all too real, all too pervasive, all too soul-destroying.
Sasha Abramsky’s most recent
book is “Jumping at Shadows: The Triumph of Fear and the End of the American
Dream.”
More than
50,000 UC workers on strike
For a political
movement of the entire working class against inequality and capitalism!
By David Moore
9 May 2018
David Moore is the Socialist
Equality Party’s candidate for senate in the California June 5 mid-term
elections. You can find out more and get involved in the campaign at socialequality.com/2018.
Tens of thousands of service workers at the University of
California (UC) are concluding their three-day strike against deteriorating pay
and conditions today.
The widespread support for the strike of services workers,
including from nurses and technical workers who have engaged in sympathy
strikes, is part of a growing wave of opposition from workers throughout the
United States and internationally. However, the unions involved have worked to
limit and contain the struggle and ensure its defeat.
In April, the UC system unilaterally imposed a contract on service
workers that increased the retirement age by five years, included a paltry two
percent wage increase, and allowed the university to outsource more jobs as
well as raise health care premiums.
The UC system is the state’s third largest employer, and the
conditions there are immediately familiar to workers across the country. Just
in the past two months there have been strikes of public school teachers and
support staff in West Virginia, Oklahoma and Arizona.
In each of these strikes, the role of the unions—the American
Federation of Teachers and the National Education Association—was to smother
opposition and shut it down. The strikes were not initiated by the unions, but
by rank-and-file teachers. The unions intervened to end the strikes and prevent
them from developing into a nationwide movement against the Democratic and
Republican parties and the capitalist system.
The teachers unions were
operating under the principle articulated by a lawyer for the American
Federation of State, County and Municipal Employees (AFSCME) in the pending
case of Janus vs.
AFSCME on
union agency fees: “Union security is the tradeoff for no strikes.” The AFSMCE
lawyer was telling the high court justices: You need us, because without us
there will be “an untold specter of labor unrest throughout the country.”
The main union involved in the UC strike is AFSCME, and it—along
with the University Professional and Technical Employees and California Nurses
Association—is putting this statement into practice. The three-day strike is
intended to let off steam, while doing nothing to resolve the conditions facing
service and other workers in the UC system.
AFSCME has a long history of calling short-term strikes and making
empty strike threats to demoralize members and force through sellout contracts.
In 2014, it cancelled planned strikes of two different sections of workers and
imposed contracts that included increases in pension contributions from
workers. In this strike, AFSCME is seeking to block widespread opposition to
the bipartisan attack on public education and workers compensation by focusing
almost entirely on racial and gender pay discrepancies that they claim can be
fixed at the university level.
The unions want to prevent any discussion of the political
background to the conditions facing UC workers. Particularly since the 2008
economic crisis, the ruling class and its two parties have slashed social
spending while cutting taxes for corporations and the rich. Within California,
the UC system’s budget has been cut by Democratic Governor Jerry Brown and the
former Republican Governor Schwarzenegger.
In 2017 the state of California provided nearly two-thirds less in
per pupil funding than it did in 1990, from $19,100 down to $7,160, after
inflation. State funding now only accounts for roughly 10 percent of the UC
budget. More than three times that amount comes from UC-run medical centers.
Those cuts have increasingly shaped every aspect of work and study
in the UC system. Custodians, groundskeepers and office staff workers are
overworked, and their departments are understaffed. University lecturers find
themselves on food stamps with no prospect of advancement. Students have seen
their tuition and debts soar.
As part of the UC’s transformation from being funded by the state
to making profits from medical and research businesses, well-heeled
administrators were brought in. Between 2005 and 2015, the total payroll cost
for the top 10 percent of UC wages grew from 22 to 31 percent, while that of
the bottom 50 percent dropped from 24 to 22 percent.
UC workers in the medical centers are doubly squeezed by the
attacks on health care that were carried out under the Affordable Care Act
(ACA), or Obamacare. Hailed by the unions and Democrats as a great reform, the
ACA has provided record profits to insurance companies while forcing low-income
workers to ration their care in overpriced plans with prohibitively high
deductibles and co-pays.
Within the medical centers and hospitals, health care workers have
been subjected to particularly sharp understaffing and speedup.
These attacks on the working class have been combined with tax
breaks, bailouts and giveaways to the ultra-rich. Nationwide, the three richest
billionaires have as much wealth as the poorest half of Americans combined.
This immense social gulf grew precipitously under the Obama administration and
continues to accelerate with the Trump tax cuts.
Both parties of big business have worked closely to funnel money
from the working class to the rich. While being run by Democrats from top to
bottom, California has grown to be the fourth most unequal state in the US,
with the largest number of billionaires and the largest homeless population.
When the cost of living is taken into account, California has the highest
poverty rate in the country, at just over 20 percent.
The unions promote the lie that Democrats are allies of workers.
Yet the Democrats voted for a record $700 billion military budget, found room
in the budget for Trump’s border wall and bailed out the banks in 2008, but
claim there is no money for education, health care and retirement.
The three-day strike will resolve nothing. I call on UC workers to
form rank-and-file committees, independent of the unions, to unite their fight
for wages and benefits with the struggles of the entire working class against
inequality and war. The conditions facing striking workers are the same as
those facing teachers, auto workers, Amazon workers, telecommunication workers,
and all sections of the working class—in the United States and internationally.
The building of rank-and-file factory and workplace committees
must be connected to a political counteroffensive against the two big-business
parties and the entire capitalist system. The resources exist to ensure
everyone the right to a high-paying job, quality health care and a secure
retirement. The problem is capitalism, a social and economic system based on
the exploitation of the working class to secure the profits of the ruling
class.
I urge all workers who agree with this program to support the SEP
campaign in the 2018 elections and join and build the Socialist Equality Party.
HAS AMERICA DESTROYED ITSELF MERELY TO MAKE THE RICH
SUPER RICH?
Viking
Economics by George Lakey
by Melville House
This week, we’re excited
to be publishing Viking Economics, George Lakey’s
look at how the Nordic countries, in a very short span of time, managed to move
past many of the problems faced by nations like the US and UK today — problems
with inequality, infrastructural weakness, the cost of education, and personal
freedom. Today, the people of Denmark, Iceland, Norway,
and Sweden enjoy widely-shared prosperity, low
crime rates, reliable infrastructure, affordable education, great personal
freedoms — some of the highest standards of living in the world.
Particularly as both the
US and the UK face some of our biggest challenges in a generation — and, in
both cases, under new leadership — Viking
Economicsoffers some crucial examples
of how we might get some things right.
Here’s a brief excerpt to
read on the longship ride over to your local bookstore to buy a copy; please try not to get herring
on it.
Like most Americans today,
Norwegians a century ago didn’t like the results of a wealth gap: the hunger
and poverty, the crime, elderly friends warehoused or left in isolation, young
people without hope of a good job. Norwegians also didn’t like the attitudes
that went with inequality: an inclination toward arrogance among higher-income
people and the feeling among lower-income people that they were losers,
defeated by the system.
Early in the twentieth
century, Norway had the formal institutions of parliamentary democracy, but
ordinary people were not empowered: they did not set the direction of their
society. The direction was set, instead, by the economic elite, through the
political parties they dominated and the businesses they ran. Career options
were limited, and there was little social mobility.
The differences between
then and now are striking: If you’re a Norwegian teenager today and the job
you’re interested in pursuing doesn’t require higher education, you can choose
among good public vocational courses. If you learn better in a hands-on
apprenticeship mode, publicly supported programs help you do that. If, instead,
you prefer to develop a talent in art or music, or follow a career at sea or in
engineering, you can attend a free post-secondary school.
Paid maternity and
paternity leave (including for adoptive parents) is built into the system, and
your job is held until you return. After the leave is over, child support is
increased if you choose to be a full-time parent. If your choice is to go back
to work, affordable childcare is available.
Extensive, subsidized
public transport means that you probably won’t need a car to get to work. High
educational standards prevail in big-city schools, as well as in the suburbs.
Small towns receive subsidies to make them attractive for people who might
otherwise feel forced to live in a city for cultural amenities, again
increasing your options. The economy subsidizes family farming both for its own
sake and for food security, so farmers can earn a reasonable income, another
freedom denied in many industrialized countries.
The government offers free
vocational counseling, education, and job-training resources for people seeking
a career change, and entrepreneurialism is encouraged through free health care
and a public pension for all: In Norway, you have the freedom to fail without
becoming a failure.
Money doesn’t dominate the
political system, so citizens are freer to participate meaningfully in
political life—and they’re more likely to be exposed to newspapers with a
variety of points of view, because journalism is subsidized to avoid a
narrowing of perspective. According to Freedom House, in 2013, Norway was tied
with Sweden at number one in the world for freedom of the press. Denmark was
sixth, and Iceland was tenth. (The United States was twenty-sixth.) Indeed,
this approach to public life has a long lineage in the region: Sweden was the
first country in the world to establish freedom of the press—in 1766.
The Nordics are among the
longest-living people in the world, and older citizens continue to benefit from
an economy designed for personal freedom. The Global Watch Index studied ninety-six
countries and rated Norway as the best place to grow old, followed closely by Sweden. The pension system enables you to live at home with
health aides or in a senior living facility. You don’t need to fear hunger or
lack of medicines or of health care. Every small town has a music and culture
center where you can enjoy the arts and pursue your hobbies.
The crime rate is very
low, partly because societies with high equality tend to experience less crime.
Even in their largest city, Norwegians enjoy a remarkable degree of freedom
from fear about personal safety.
Designing an economy that
supports freedom and equality pays off in happiness, judging from the Vikings’
descendants making the top ten in the UN’s International Happiness Index. In
2015, the ratings showed Denmark, Iceland, and Norway sharing first
place with Switzerland, while Sweden was close to its cousins.
The Organization for
Economic Co-operation and Development (OECD), composed of thirty-four of the
most-developed nations, compared life satisfaction experienced by the people in
each country in 2013. The OECD found
Norway second, Iceland third, Sweden fourth, and Denmark fifth.
And yet in spite of all
this security and support, the Nordic yen for adventure has not disappeared.
Americans, too, have a strong yearning for both freedom and equality, so the
Nordic desire for both isn’t surprising. What is surprising, though, is that
they went ahead and built an economy to serve those values. That’s the story in
this book.
Like their Viking
ancestors, the moderns made mistakes in their explorations. Iceland’s financial
collapse of 2008 was a spectacular error, and, as I’ll describe, back in the
1980s, the Norwegians and Swedes made a series of serious economic mistakes.
The Nordics haven’t built a utopia: Norwegians see themselves as “a nation of
complainers,” and this book doesn’t shy away from the challenges that face them
and their Nordic cousins.
Still, it’s useful for us
as outsiders to observe the Nordics’ expeditions and to use them to reflect on
our own situations. There are many important lessons to be learned.
WHY AMERICA
CAN’T LOWER CHILD POVERTY LEVELS
Economy,
finance, and budgets
The
Social Order
Articles about
America’s high levels of child poverty are a media evergreen. Here’s a typical
entry, courtesy of the New York Times’s Eduardo
Porter: “The percentage of children who are poor is more than three times as
high in the United States as it is in Norway or the Netherlands. America has a
larger proportion of poor children than Russia.” That’s right: Russia.
Outrageous as they seem, the assertions are
true—at least in the sense that they line up with official statistics from
government agencies and reputable nongovernmental organizations like the OECD
and UNICEF. International comparisons of the sort that Porter makes, though,
should be accompanied by a forest of asterisks. Data limitations, varying
definitions of poverty, and other wonky problems are rampant in these
discussions.
The lousy child-poverty numbers should come
with another qualifying asterisk, pointing to a very American reality. Before
Europe’s recent migration crisis, the United States was the only developed
country consistently to import millions of very poor, low-skilled families,
from some of the most destitute places on earth—especially from undeveloped
areas of Latin America—into its communities, schools, and hospitals. Let’s just
say that Russia doesn’t care to do this—and, until recently, Norway and the
Netherlands didn’t, either. Both policymakers and pundits prefer silence on the
relationship between America’s immigration system and poverty, and it’s easy to
see why. The subject pushes us headlong into the sort of wrenching trade-offs
that politicians and advocates prefer to avoid. Here’s the problem in a
nutshell: you can allow mass low-skilled immigration, which many on the left
and the right—and probably most poverty mavens—consider humane and
quintessentially American. But if you do, pursuing the equally humane goal of
substantially reducing child poverty becomes a lot harder.
In 1964, the federal
government settled on a standard definition of poverty: an income less than
three times the value of a hypothetical basic food basket. (That approach has
its flaws, but it’s the measure used in the United States, so we’ll stick with
it.) Back then, close to 23 percent of American kids were poor. With the
important exception of the years between 1999 and 2007—following the
introduction of welfare reform in 1996—when it declined to 16 percent, child
poverty has bounced within three points of 20 percent since 1980. Currently,
about 18 percent of kids are below the poverty line, amounting to 13,250,000
children. Other Anglo countries have lower child-poverty rates: the OECD puts
Canada’s at 15 percent, with the United Kingdom and Australia lower still,
between 11 percent and 13 percent. The lowest levels of all—under 10 percent—are
found in the Nordic countries: Denmark, Norway, Iceland, and Finland.
How does immigration affect those post-1964
American child-poverty figures? Until 1980, it didn’t. The 1924 Immigration Act
sharply reduced the number of immigrants from poorer Eastern European and
southern countries, and it altogether banned Asians. (Mexicans, who had come to
the U.S. as temporary agricultural workers and generally returned to their home
country, weren’t imagined as potential citizens and thus were not subject to restrictive
quotas.) The relatively small number of immigrants settling in the U.S. tended
to be from affluent nations and had commensurate skills. According to the
Migration Policy Institute, in 1970, immigrant children were less likely to be
poor than were the children of native-born Americans.
By 1980, chiefly because of the 1965
Immigration and Naturalization Act, the situation had reversed: immigrant kids
were now poorer than native-born ones. That 1965 law, overturning the 1924
restrictions, made “family preference” a cornerstone of immigration policy—and,
as it turned out, that meant a growing number of new Americans hailing from
less-developed countries and lacking skills. The income gap between immigrant
and native children widened. As of 1990, immigrant kids had poverty rates 50
percent higher than their native counterparts. At the turn of the millennium,
more than one-fifth of immigrant children, compared with just 9 percent of
non-Hispanic white kids, were classified as poor. Today, according to Center
for Immigration Studies estimates, 31.1 percent of the poor under 18 are either
immigrants or the American-born kids of immigrant parents.
Perhaps the most uncomfortable truth about
these figures, and surely one reason they don’t often show up in media accounts,
is that a large majority of America’s poor immigrant children—and, at this
point, a large fraction of all its poor children—are Hispanic (see chart
below). The U.S. started collecting separate poverty data on Hispanics in 1972.
That year, 22.8 percent of those originally from Spanish-language countries of
Latin America were poor. The percentage hasn’t risen that dramatically since
then; it’s now at 25.6 percent. But because the Hispanic population in America
quintupled during those years, these immigrants substantially expanded the
nation’s poverty rolls. Hispanics are now the largest U.S. immigrant group by
far—and the lowest-skilled. Pew estimates that Hispanics accounted for more
than half the 22-million-person rise in the official poverty numbers between
1972 and 2012. Robert Samuelson of the Washington Post found
that, between 1990 and 2016, Hispanics drove nearly three-quarters of the
increase in the nation’s poverty population from 33.6 million to 40.6 million.
Ironically, then, at the same time that
America’s War on Poverty was putting a spotlight on poor children, the new
immigration system was steadily making the problem worse. In 1980, only 9
percent of American children were Hispanic. By 2009, that number had climbed to
22 percent. Almost two-thirds of these children were first- or
second-generation immigrants, most of whose parents were needy. Nowadays, 31
percent of the country’s Hispanic children are in poverty. That percentage
remains somewhat lower than the 36 percent of black children who are poor,
true; but because the raw number of poor Hispanic kids—5.1 million—is so much
higher (poor black children number 3.7 million), they make up by far the
largest group in the child-poverty statistics. As of 2016, Hispanic children
account for more than one-third of America’s poor children. Between 1999 and
2008 alone, the U.S. added 1.8 million children to the poverty rolls; the
Center for Immigration Studies reports that immigrants accounted for 45 percent
of them.
Let’s be clear:
Hispanic immigration isn’t the only reason that the U.S. has such troubling
child-poverty rates. Other immigrant groups, such as North Africans and
Laotians, add to the ranks of the under-18 poor. And American Indians have the
highest rates of child poverty of all ethnic and racial groups. These are
relatively small populations, however; combine Indians and Laotians, and you
get fewer than a half-million poor children—a small chunk of the 14-plus
million total.
Even if we were following the immigration
quotas set in 1924, the U.S. would be something of a child-poverty outlier. The
nation’s biggest embarrassment is the alarming percentage of black children
living in impoverished homes. Unsurprisingly, before the civil rights movement,
the numbers were higher; in 1966, almost 42 percent of black kids were poor.
But those percentages started to improve in the later 1960s and in the 1970s.
Then they soared again. By the 1980s and early 1990s, black child poverty was
hovering miserably between 42 percent and almost 47 percent. Researchers
attribute the lack of progress to the explosion in single-parent black families
and welfare use. The current percentage of black kids living with a single
mother—66 percent—far surpasses that of any other demographic group. The 1996
welfare-reform bill and a strong economy helped bring black child poverty below
40 percent, a public-policy success—but the numbers remain far too high.
Policymakers and pundits prefer silence on the relationship
between America’s immigration system and poverty.
Immigrant poverty, though usually lumped
within a single “child-poverty” number, belongs in a different category from
black or Native American poverty. After all, immigrants voluntarily came to the
United States, usually seeking opportunity. And immigrants of the past often
found it. The reality of American upward mobility helps explain why, despite
real hardships, poor immigrant childhood became such a powerful theme in
American life and literature. Think of classic coming-of-age novels like Betty
Smith’s A
Tree Grows in Brooklyn (about Irish
immigrants), Henry Roth’s Call It Sleep (Jewish
immigrants), and Paule Marshall’s Brown Girl, Brownstones (West
Indians), all set in the first decades of the twentieth century. With low pay,
miserable work conditions, and unreliable hours, the immigrant groups that such
novels depicted so realistically were as poor as—and arguably more openly
discriminated against than—today’s Mexicans or Bangladeshis.
Their children, though, didn’t need a ton
of education to leave the hard-knocks life behind. While schools of that era
were doubtless more committed to assimilating young newcomers than are today’s
diversity-celebrating institutions, sky-high dropout rates limited their
impact. At the turn of the twentieth century, only 5 percent of the total
population graduated from high school; the rate among immigrants would have
been even lower. That doesn’t mean that education brought no advantages. Though
economist George Borjas notes that endemic truancy and interrupted studies had
ripple effects on incomes into following generations, the pre–World War II
industrial economy offered a “range of blue collar opportunities” for immigrant
children, as sociologists Roger Waldinger and Joel Perlman observe, and it required
“only modest educations to move a notch or two above their parents.” It may
have taken more than one generation, but most immigrant families could expect,
if not Horatio Alger–style ascents, at least middle-class stability over time.
America’s economy has transformed in ways
that have blocked many of the avenues to upward mobility available to the
immigrant families of the past. The kind of middle-skilled jobs that once fed
the aspirations of low-income strivers are withering. “Modest educations” will no
longer raise poor immigrant children above their parents’ station. Drop out of
high school, and you’ll be lucky to be making sandwiches at a local deli or
cleaning rooms at a Motel 6. Even a high school diploma can be a dead end,
unless supplemented by the right kind of technical training. Get a college
degree, however, and it is a different, happier, story.
Yes, some immigrant groups known for their
obsessional devotion to their children’s educational attainment (Chinese and
Vietnamese immigrants come to mind) still have a good shot at middle-class
stability, even though the parents typically arrive in America with little
skill or education and, working in low-wage occupations, add to poverty numbers
in the short term. But researchers have followed several generations of
Hispanics—again, by far the largest immigrant group—and what they’ve found is
much less encouraging. Hispanic immigrants start off okay. Raised in the U.S.,
the second generation graduates high school and goes to college at higher rates
than its parents, and it also earns more, though it continues to lag
significantly behind native-born and other immigrant groups in these outcomes.
Unfortunately, the third generation either stalls, or worse, takes what the
Urban Institute calls a “U-turn.” Between the second and third generation,
Hispanic high school dropout rates go up and college-going declines. The third
generation is more often disconnected—that is, neither attending school nor
employed. Its income declines; its health, including obesity levels, looks
worse. Most disturbing, as we look to the future, a third-generation Hispanic
is more likely to be born to a single mother than were his first- or
second-generation predecessors. The children of single mothers not only have
high poverty rates, regardless of ethnic or racial background; they’re also
less likely to experience upward mobility, as a mountain of data shows.
The Hispanic “U-turn” probably has many
causes. Like most parents these days, Hispanics say that they believe that
education is essential for their children’s success. Cultural norms that prize
family and tradition over achievement and independence often stand in the way.
According to a study in the Hispanic Journal of Behavioral Sciences, Hispanic parents don’t talk and read to their young
children as much as typical middle-class parents, who tend to applaud their
children’s attempts at self-expression, do; differences in verbal ability show
up as early as age two. Hispanic parents of low-achieving students, most of
whom also voiced high academic hopes for their kids, were still “happy with
their children’s test scores even when the children performed poorly.” Their
children tended to be similarly satisfied. Unlike many other aspiring parents,
Hispanics are more reluctant to see their children travel to magnet schools and
to college. They also become parents at younger ages. Though Hispanic teen
birthrates have fallen—as they have for all groups, apart from American
Indians—they remain the highest in the nation.
The sheer size of the Hispanic population
hinders the assimilation that might moderate some of these preferences.
Immigrants have always moved into ethnic enclaves in the United States when
they could, but schools and workplaces and street life inevitably meant mixing
with other kinds, even when they couldn’t speak the same language. In many
parts of the country, though, Hispanics are easily able to stick to their own.
In fact, Generations
of Exclusion, a longitudinal study of
several generations of Mexican-Americans, found that a majority of fourth-generation Mexican-Americans live in Hispanic
neighborhoods and marry other Hispanics.
Other affluent
countries have lots of immigrants struggling to make it in a postindustrial
economy. Those countries have lower child-poverty rates than we do—some much
lower. But the background of the immigrants they accept is very different.
Canada, New Zealand, and Australia are probably the best points of comparison.
Like the United States, they are part of the Anglosphere and historically
multicultural, with large numbers of foreign-born residents. However, unlike
the U.S., they all use a points system that considers education levels and
English ability, among other skills, to determine who gets immigration visas.
The Brookings Institution’s Hamilton Project calculates that, while 30 percent
of American immigrants have a low level of education—meaning less than a high
school diploma—and 35 percent have a college degree or higher, only 22 percent
of Canadian immigrants lack a high school diploma, while more than 46 percent
have gone to college. (Canada tightened its points system after a government
study found that a rise in poverty and inequality during the 1980s and 1990s
could be almost entirely attributed to an influx of poorer immigrants.)
Australia and New Zealand also have a considerably more favorable ratio of
college-educated immigrants than does the United States. The same goes for the
U.K.
The immigration ecosystem of the famously
egalitarian Nordic countries also differs from the U.S.’s in ways that have
kept their poverty numbers low. Historically, the Nordics didn’t welcome large
numbers of greenhorns. As of 1940, for instance, only 1 percent of Sweden’s
population was foreign-born, compared with almost 8.8 percent of Americans.
After World War II, Nordic immigration numbers began rising, with most of the
newcomers arriving from developed countries, as was the case in the U.S. until
1965. In Finland and Iceland, for instance, the plurality of immigrants today
is Swedish and Polish, respectively. In Norway, the majority of immigrants come
from Poland and Lithuania. Note that these groups have low poverty rates in the
U.S., too.
Sweden presents the most interesting case,
since it has been the most welcoming of the Nordic countries—and it has one of
the most generous welfare states, providing numerous benefits for its
immigrants. For a long time, the large majority of Sweden’s immigrants were
from Finland, a country with a similar culture and economy. By the 1990s, the
immigrant population began to change, though, as refugees arrived from the
former Yugoslavia, Iran, and Iraq—populations with little in common culturally
with Sweden and far more likely to be unskilled than immigrants from the
European Union. By 2011, Sweden, like other European countries, was seeing an
explosion in the number of asylum applicants from Syria, Afghanistan, and
Africa; in 2015 and 2016, there was another spike. Sweden’s percentage of
foreign-born has swelled to 17 percent—higher than the approximately 13 percent
in the United States.
How has Sweden handled its growing
diversity? We don’t have much reliable data from the most recent surge, but
numbers from earlier this decade suggest the limits of relying on copious state
benefits to acclimate cultural outsiders. In the U.S., immigrants are still
more likely to be employed than are the native-born. In Sweden, the opposite holds.
More than 26 percent of Swedish newcomers have remained unemployed long-term
(for more than a year). Immigrants tend to be poorer than natives and more
likely to fall back into poverty if they do surmount it. In fact, Sweden has
one of the highest poverty rates among immigrants relative to native-born in
the European Union. Most strikingly, a majority of children living in Sweden
classified as poor in 2010 were immigrants.
Despite its resolute antipoverty efforts,
Sweden has, if anything, been less successful than the U.S. at bringing its
second-generation immigrants up to speed. According to the OECD’s Programme for
International Student Assessment (PISA) survey, Sweden has “declined over the
past decade [between 2005 and 2015] from around average to significantly below
average . . . . No other country taking part in PISA has seen a steeper fall.”
The Swedish Education Agency reports that immigrant kids were responsible for
85 percent of a decline in school performance.
Outcomes like these
suggest that immigration optimists have underestimated the difficulty of
integrating the less-educated from undeveloped countries, and their children,
into advanced economies. A more honest accounting raises tough questions.
Should the United States, as the Trump administration is proposing, and as is
already the case in Canada and Australia, pursue a policy favoring
higher-skilled immigration? Or do we accept higher levels of child poverty and
lower social mobility as a cost of giving refuge and opportunity to people with
none? If we accept such costs, does it even make sense to compare our
child-poverty numbers with those of countries like Denmark or Sweden, which
have only recently begun to take in large numbers of low-skilled immigrants?
Recent events in Denmark and Sweden put
another question in stark relief. How many newcomers—especially from very
different cultures—can a country successfully absorb, and on what timetable? A
surge of asylum seekers beginning in 2015 forced both countries to introduce
controls at their borders and limits to asylum acceptances. Their existing
social services proved unable to cope with the swelling ranks of the needy;
there was not enough housing, and, well, citizens weren’t always as welcoming
as political leaders might have wished. The growing power of anti-immigrant
political parties has shocked these legendarily tolerant cultures.
And yet one more question: How long can
generous welfare policies survive large-scale low-skilled immigration? The
beneficent Nordic countries are not the only ones that need to wonder. The
National Academies of Sciences finds that immigration to America has an overall
positive impact on the fiscal health of the federal government, but not so for
the states and localities that must pay for education, libraries, some social
services, and a good chunk of Medicaid. Fifty-five percent of California’s
immigrant families use some kind of means-tested benefits; for natives, it’s 30
percent. The centrist Hamilton Project observes that high-immigrant
states—California, New York, New Jersey, among others—“may be burdened with
costs that will only be recouped over a number of years, or, if children move
elsewhere within the United States, may never fully be recovered.”
In short, confronting honestly the question
of child-poverty rates in the United States—and, increasingly, such rates in
other advanced countries—means acknowledging the reality that a newcomer’s
background plays a vital role in immigrant success. Alternatively, of course, one
can always fall back on damning worries about our current immigration system as
evidence of racism. Remember November 8, 2016, if you want to know how that
will play out.
*
*
*
Articles about
America’s high levels of child poverty are a media evergreen. Here’s a typical
entry, courtesy of the New York Times’s Eduardo
Porter: “The percentage of children who are poor is more than three times as
high in the United States as it is in Norway or the Netherlands. America has a
larger proportion of poor children than Russia.” That’s right: Russia.
Outrageous as they seem, the assertions are
true—at least in the sense that they line up with official statistics from
government agencies and reputable nongovernmental organizations like the OECD
and UNICEF. International comparisons of the sort that Porter makes, though,
should be accompanied by a forest of asterisks. Data limitations, varying
definitions of poverty, and other wonky problems are rampant in these
discussions.
The lousy child-poverty numbers should come
with another qualifying asterisk, pointing to a very American reality. Before
Europe’s recent migration crisis, the United States was the only developed
country consistently to import millions of very poor, low-skilled families,
from some of the most destitute places on earth—especially from undeveloped
areas of Latin America—into its communities, schools, and hospitals. Let’s just
say that Russia doesn’t care to do this—and, until recently, Norway and the
Netherlands didn’t, either. Both policymakers and pundits prefer silence on the
relationship between America’s immigration system and poverty, and it’s easy to
see why. The subject pushes us headlong into the sort of wrenching trade-offs
that politicians and advocates prefer to avoid. Here’s the problem in a
nutshell: you can allow mass low-skilled immigration, which many on the left
and the right—and probably most poverty mavens—consider humane and
quintessentially American. But if you do, pursuing the equally humane goal of substantially
reducing child poverty becomes a lot harder.
In 1964, the federal
government settled on a standard definition of poverty: an income less than
three times the value of a hypothetical basic food basket. (That approach has
its flaws, but it’s the measure used in the United States, so we’ll stick with
it.) Back then, close to 23 percent of American kids were poor. With the
important exception of the years between 1999 and 2007—following the
introduction of welfare reform in 1996—when it declined to 16 percent, child
poverty has bounced within three points of 20 percent since 1980. Currently,
about 18 percent of kids are below the poverty line, amounting to 13,250,000
children. Other Anglo countries have lower child-poverty rates: the OECD puts
Canada’s at 15 percent, with the United Kingdom and Australia lower still,
between 11 percent and 13 percent. The lowest levels of all—under 10
percent—are found in the Nordic countries: Denmark, Norway, Iceland, and
Finland.
How does immigration affect those post-1964
American child-poverty figures? Until 1980, it didn’t. The 1924 Immigration Act
sharply reduced the number of immigrants from poorer Eastern European and
southern countries, and it altogether banned Asians. (Mexicans, who had come to
the U.S. as temporary agricultural workers and generally returned to their home
country, weren’t imagined as potential citizens and thus were not subject to
restrictive quotas.) The relatively small number of immigrants settling in the
U.S. tended to be from affluent nations and had commensurate skills. According
to the Migration Policy Institute, in 1970, immigrant children were less likely
to be poor than were the children of native-born Americans.
By 1980, chiefly because of the 1965
Immigration and Naturalization Act, the situation had reversed: immigrant kids
were now poorer than native-born ones. That 1965 law, overturning the 1924
restrictions, made “family preference” a cornerstone of immigration policy—and,
as it turned out, that meant a growing number of new Americans hailing from
less-developed countries and lacking skills. The income gap between immigrant
and native children widened. As of 1990, immigrant kids had poverty rates 50
percent higher than their native counterparts. At the turn of the millennium, more
than one-fifth of immigrant children, compared with just 9 percent of
non-Hispanic white kids, were classified as poor. Today, according to Center
for Immigration Studies estimates, 31.1 percent of the poor under 18 are either
immigrants or the American-born kids of immigrant parents.
Perhaps the most uncomfortable truth about
these figures, and surely one reason they don’t often show up in media
accounts, is that a large majority of America’s poor immigrant children—and, at
this point, a large fraction of all its poor children—are Hispanic (see chart
below). The U.S. started collecting separate poverty data on Hispanics in 1972.
That year, 22.8 percent of those originally from Spanish-language countries of
Latin America were poor. The percentage hasn’t risen that dramatically since
then; it’s now at 25.6 percent. But because the Hispanic population in America
quintupled during those years, these immigrants substantially expanded the
nation’s poverty rolls. Hispanics are now the largest U.S. immigrant group by
far—and the lowest-skilled. Pew estimates that Hispanics accounted for more
than half the 22-million-person rise in the official poverty numbers between
1972 and 2012. Robert Samuelson of the Washington Post found
that, between 1990 and 2016, Hispanics drove nearly three-quarters of the
increase in the nation’s poverty population from 33.6 million to 40.6 million.
Ironically, then, at the same time that
America’s War on Poverty was putting a spotlight on poor children, the new immigration
system was steadily making the problem worse. In 1980, only 9 percent of
American children were Hispanic. By 2009, that number had climbed to 22
percent. Almost two-thirds of these children were first- or second-generation
immigrants, most of whose parents were needy. Nowadays, 31 percent of the
country’s Hispanic children are in poverty. That percentage remains somewhat
lower than the 36 percent of black children who are poor, true; but because the
raw number of poor Hispanic kids—5.1 million—is so much higher (poor black
children number 3.7 million), they make up by far the largest group in the
child-poverty statistics. As of 2016, Hispanic children account for more than
one-third of America’s poor children. Between 1999 and 2008 alone, the U.S. added
1.8 million children to the poverty rolls; the Center for Immigration Studies
reports that immigrants accounted for 45 percent of them.
Let’s be clear:
Hispanic immigration isn’t the only reason that the U.S. has such troubling
child-poverty rates. Other immigrant groups, such as North Africans and
Laotians, add to the ranks of the under-18 poor. And American Indians have the
highest rates of child poverty of all ethnic and racial groups. These are
relatively small populations, however; combine Indians and Laotians, and you
get fewer than a half-million poor children—a small chunk of the 14-plus
million total.
Even if we were following the immigration
quotas set in 1924, the U.S. would be something of a child-poverty outlier. The
nation’s biggest embarrassment is the alarming percentage of black children
living in impoverished homes. Unsurprisingly, before the civil rights movement,
the numbers were higher; in 1966, almost 42 percent of black kids were poor.
But those percentages started to improve in the later 1960s and in the 1970s.
Then they soared again. By the 1980s and early 1990s, black child poverty was
hovering miserably between 42 percent and almost 47 percent. Researchers
attribute the lack of progress to the explosion in single-parent black families
and welfare use. The current percentage of black kids living with a single
mother—66 percent—far surpasses that of any other demographic group. The 1996
welfare-reform bill and a strong economy helped bring black child poverty below
40 percent, a public-policy success—but the numbers remain far too high.
Policymakers and pundits prefer silence on the relationship
between America’s immigration system and poverty.
Immigrant poverty, though usually lumped
within a single “child-poverty” number, belongs in a different category from
black or Native American poverty. After all, immigrants voluntarily came to the
United States, usually seeking opportunity. And immigrants of the past often
found it. The reality of American upward mobility helps explain why, despite
real hardships, poor immigrant childhood became such a powerful theme in
American life and literature. Think of classic coming-of-age novels like Betty
Smith’s A
Tree Grows in Brooklyn (about Irish
immigrants), Henry Roth’s Call It Sleep (Jewish immigrants),
and Paule Marshall’s Brown Girl, Brownstones (West
Indians), all set in the first decades of the twentieth century. With low pay,
miserable work conditions, and unreliable hours, the immigrant groups that such
novels depicted so realistically were as poor as—and arguably more openly
discriminated against than—today’s Mexicans or Bangladeshis.
Their children, though, didn’t need a ton
of education to leave the hard-knocks life behind. While schools of that era
were doubtless more committed to assimilating young newcomers than are today’s
diversity-celebrating institutions, sky-high dropout rates limited their
impact. At the turn of the twentieth century, only 5 percent of the total
population graduated from high school; the rate among immigrants would have
been even lower. That doesn’t mean that education brought no advantages. Though
economist George Borjas notes that endemic truancy and interrupted studies had
ripple effects on incomes into following generations, the pre–World War II
industrial economy offered a “range of blue collar opportunities” for immigrant
children, as sociologists Roger Waldinger and Joel Perlman observe, and it
required “only modest educations to move a notch or two above their parents.”
It may have taken more than one generation, but most immigrant families could
expect, if not Horatio Alger–style ascents, at least middle-class stability
over time.
America’s economy has transformed in ways
that have blocked many of the avenues to upward mobility available to the
immigrant families of the past. The kind of middle-skilled jobs that once fed
the aspirations of low-income strivers are withering. “Modest educations” will
no longer raise poor immigrant children above their parents’ station. Drop out
of high school, and you’ll be lucky to be making sandwiches at a local deli or
cleaning rooms at a Motel 6. Even a high school diploma can be a dead end,
unless supplemented by the right kind of technical training. Get a college
degree, however, and it is a different, happier, story.
Yes, some immigrant groups known for their
obsessional devotion to their children’s educational attainment (Chinese and
Vietnamese immigrants come to mind) still have a good shot at middle-class
stability, even though the parents typically arrive in America with little
skill or education and, working in low-wage occupations, add to poverty numbers
in the short term. But researchers have followed several generations of
Hispanics—again, by far the largest immigrant group—and what they’ve found is
much less encouraging. Hispanic immigrants start off okay. Raised in the U.S.,
the second generation graduates high school and goes to college at higher rates
than its parents, and it also earns more, though it continues to lag
significantly behind native-born and other immigrant groups in these outcomes.
Unfortunately, the third generation either stalls, or worse, takes what the
Urban Institute calls a “U-turn.” Between the second and third generation,
Hispanic high school dropout rates go up and college-going declines. The third
generation is more often disconnected—that is, neither attending school nor
employed. Its income declines; its health, including obesity levels, looks
worse. Most disturbing, as we look to the future, a third-generation Hispanic
is more likely to be born to a single mother than were his first- or
second-generation predecessors. The children of single mothers not only have
high poverty rates, regardless of ethnic or racial background; they’re also
less likely to experience upward mobility, as a mountain of data shows.
The Hispanic “U-turn” probably has many
causes. Like most parents these days, Hispanics say that they believe that
education is essential for their children’s success. Cultural norms that prize
family and tradition over achievement and independence often stand in the way.
According to a study in the Hispanic Journal of Behavioral Sciences, Hispanic parents don’t talk and read to their young
children as much as typical middle-class parents, who tend to applaud their
children’s attempts at self-expression, do; differences in verbal ability show
up as early as age two. Hispanic parents of low-achieving students, most of
whom also voiced high academic hopes for their kids, were still “happy with
their children’s test scores even when the children performed poorly.” Their
children tended to be similarly satisfied. Unlike many other aspiring parents,
Hispanics are more reluctant to see their children travel to magnet schools and
to college. They also become parents at younger ages. Though Hispanic teen
birthrates have fallen—as they have for all groups, apart from American
Indians—they remain the highest in the nation.
The sheer size of the Hispanic population
hinders the assimilation that might moderate some of these preferences.
Immigrants have always moved into ethnic enclaves in the United States when
they could, but schools and workplaces and street life inevitably meant mixing
with other kinds, even when they couldn’t speak the same language. In many
parts of the country, though, Hispanics are easily able to stick to their own.
In fact, Generations
of Exclusion, a longitudinal study of
several generations of Mexican-Americans, found that a majority of fourth-generation Mexican-Americans live in Hispanic
neighborhoods and marry other Hispanics.
Other affluent
countries have lots of immigrants struggling to make it in a postindustrial
economy. Those countries have lower child-poverty rates than we do—some much
lower. But the background of the immigrants they accept is very different.
Canada, New Zealand, and Australia are probably the best points of comparison.
Like the United States, they are part of the Anglosphere and historically
multicultural, with large numbers of foreign-born residents. However, unlike
the U.S., they all use a points system that considers education levels and
English ability, among other skills, to determine who gets immigration visas.
The Brookings Institution’s Hamilton Project calculates that, while 30 percent
of American immigrants have a low level of education—meaning less than a high
school diploma—and 35 percent have a college degree or higher, only 22 percent
of Canadian immigrants lack a high school diploma, while more than 46 percent
have gone to college. (Canada tightened its points system after a government study
found that a rise in poverty and inequality during the 1980s and 1990s could be
almost entirely attributed to an influx of poorer immigrants.) Australia and
New Zealand also have a considerably more favorable ratio of college-educated
immigrants than does the United States. The same goes for the U.K.
The immigration ecosystem of the famously
egalitarian Nordic countries also differs from the U.S.’s in ways that have
kept their poverty numbers low. Historically, the Nordics didn’t welcome large
numbers of greenhorns. As of 1940, for instance, only 1 percent of Sweden’s
population was foreign-born, compared with almost 8.8 percent of Americans.
After World War II, Nordic immigration numbers began rising, with most of the
newcomers arriving from developed countries, as was the case in the U.S. until
1965. In Finland and Iceland, for instance, the plurality of immigrants today
is Swedish and Polish, respectively. In Norway, the majority of immigrants come
from Poland and Lithuania. Note that these groups have low poverty rates in the
U.S., too.
Sweden presents the most interesting case,
since it has been the most welcoming of the Nordic countries—and it has one of
the most generous welfare states, providing numerous benefits for its
immigrants. For a long time, the large majority of Sweden’s immigrants were
from Finland, a country with a similar culture and economy. By the 1990s, the
immigrant population began to change, though, as refugees arrived from the
former Yugoslavia, Iran, and Iraq—populations with little in common culturally
with Sweden and far more likely to be unskilled than immigrants from the
European Union. By 2011, Sweden, like other European countries, was seeing an
explosion in the number of asylum applicants from Syria, Afghanistan, and Africa;
in 2015 and 2016, there was another spike. Sweden’s percentage of foreign-born
has swelled to 17 percent—higher than the approximately 13 percent in the
United States.
How has Sweden handled its growing
diversity? We don’t have much reliable data from the most recent surge, but
numbers from earlier this decade suggest the limits of relying on copious state
benefits to acclimate cultural outsiders. In the U.S., immigrants are still
more likely to be employed than are the native-born. In Sweden, the opposite
holds. More than 26 percent of Swedish newcomers have remained unemployed
long-term (for more than a year). Immigrants tend to be poorer than natives and
more likely to fall back into poverty if they do surmount it. In fact, Sweden
has one of the highest poverty rates among immigrants relative to native-born
in the European Union. Most strikingly, a majority of children living in Sweden
classified as poor in 2010 were immigrants.
Despite its resolute antipoverty efforts,
Sweden has, if anything, been less successful than the U.S. at bringing its
second-generation immigrants up to speed. According to the OECD’s Programme for
International Student Assessment (PISA) survey, Sweden has “declined over the
past decade [between 2005 and 2015] from around average to significantly below
average . . . . No other country taking part in PISA has seen a steeper fall.”
The Swedish Education Agency reports that immigrant kids were responsible for
85 percent of a decline in school performance.
Outcomes like these
suggest that immigration optimists have underestimated the difficulty of
integrating the less-educated from undeveloped countries, and their children,
into advanced economies. A more honest accounting raises tough questions.
Should the United States, as the Trump administration is proposing, and as is
already the case in Canada and Australia, pursue a policy favoring
higher-skilled immigration? Or do we accept higher levels of child poverty and
lower social mobility as a cost of giving refuge and opportunity to people with
none? If we accept such costs, does it even make sense to compare our
child-poverty numbers with those of countries like Denmark or Sweden, which
have only recently begun to take in large numbers of low-skilled immigrants?
Recent events in Denmark and Sweden put
another question in stark relief. How many newcomers—especially from very
different cultures—can a country successfully absorb, and on what timetable? A
surge of asylum seekers beginning in 2015 forced both countries to introduce
controls at their borders and limits to asylum acceptances. Their existing
social services proved unable to cope with the swelling ranks of the needy;
there was not enough housing, and, well, citizens weren’t always as welcoming
as political leaders might have wished. The growing power of anti-immigrant
political parties has shocked these legendarily tolerant cultures.
And yet one more question: How long can
generous welfare policies survive large-scale low-skilled immigration? The
beneficent Nordic countries are not the only ones that need to wonder. The
National Academies of Sciences finds that immigration to America has an overall
positive impact on the fiscal health of the federal government, but not so for
the states and localities that must pay for education, libraries, some social
services, and a good chunk of Medicaid. Fifty-five percent of California’s
immigrant families use some kind of means-tested benefits; for natives, it’s 30
percent. The centrist Hamilton Project observes that high-immigrant states—California,
New York, New Jersey, among others—“may be burdened with costs that will only
be recouped over a number of years, or, if children move elsewhere within the
United States, may never fully be recovered.”
In short, confronting honestly the question
of child-poverty rates in the United States—and, increasingly, such rates in
other advanced countries—means acknowledging the reality that a newcomer’s
background plays a vital role in immigrant success. Alternatively, of course,
one can always fall back on damning worries about our current immigration
system as evidence of racism. Remember November 8, 2016, if you want to know
how that will play out.
A young girl eats at a Salvation Army Thanksgiving dinner
in Santa Ana, California. (ALLEN J. SCHABEN/LOS ANGELES TIMES/GETTY IMAGES)
“Third-generation Latinos are
more often disconnected — that is, they neither attend school nor find
employment.”
Why does the U.S. have such an outlier child poverty rate?
Our immigration system has a lot to do with it
Immigrant children from El Salvador and Guatemala who entered
the country illegally board a bus after they were released from a family
detention center in San Antonio, Texas on July 7, 2015. (Eric Gay / Associated
Press)
Articles about America’s high levels of child poverty are a
media evergreen. Here’s a typical entry, courtesy of the New York Times’s
Eduardo Porter: “The percentage of children who are poor is more than three
times as high in the United States as it is in Norway or the Netherlands.
America has a larger proportion of poor children than Russia.” That’s right:
Russia.
Outrageous as they seem, the
assertions are true — at least in the sense that they line up with official
statistics. Comparisons of the sort that Porter makes, though, should be
accompanied by an asterisk pointing to a very American reality. Before Europe’s recent migration crisis,
the United States was the only developed country to routinely import millions
of very poor, low-skilled families, from some of the most destitute places on
Earth — especially from undeveloped areas of Latin America — into its
communities, schools and hospitals. Let’s just say that Russia doesn’t care
to do this — and, until recently, Norway and the Netherlands didn’t, either.
Pundits prefer silence on the
relationship between America’s immigration system and poverty, and it’s easy to
see why. The subject pushes us into the sort of wrenching trade-offs that
politicians and advocates prefer to avoid. Here’s the problem in a nutshell:
You can allow mass low-skilled immigration, which many consider humane. But if
you do, it becomes a lot harder to pursue the equally humane goal of reducing
child poverty in this country.
::
In 1964, the federal
government settled on a standard definition of poverty: an annual income less
than three times the amount required to feed a family (size dependent) over
that period of time. Back then, close to 23% of American kids were poor. Today,
about 18% of kids are below the poverty line, amounting to 13,250,000 children.
A large majority of America’s poor immigrant children — and, at
this point, a large fraction of all its poor children — are Latino.
At first, immigration did not
affect child-poverty figures. The 1924 Immigration Act sharply reduced the
number of immigrants from poorer Eastern European and southern countries, and
it altogether banned Asians. The relatively small number of immigrants settling
in the United States tended to be from affluent nations. According to the
Migration Policy Institute, in 1970, immigrant children were less likely to be
poor than were the children of native-born Americans.
By 1980, the situation had reversed:
immigrant kids were now poorer than native-born ones. Why? The 1965 Immigration
and Naturalization Act overturned the 1924 restrictions and made “family
preference” a cornerstone of immigration policy. In consequence of that move,
as well as large-scale illegal immigration, a growing number of new Americans
hailed from less-developed countries. As of 1990, immigrant kids had poverty
rates 50% higher than their native counterparts. At the turn of the millennium,
more than one-fifth of immigrant children were classified as poor.
Perhaps the most
uncomfortable truth about these statistics is that a large majority of
America’s poor immigrant children — and, at this point, a large fraction of all
its poor children — are Latino.
The United States started
collecting separate poverty data on Latinos in 1972. That year, 22.8% of those
originally from Spanish-language countries of Latin America were poor. The
percentage hasn’t risen dramatically since then; it’s now at 25.6%. But because
the Latino population in America quintupled during those years, these
immigrants substantially expanded the nation’s poverty rolls. Latinos are now
the largest U.S. immigrant group by far — and the lowest-skilled. Pew estimates
that Latinos accounted for more than half the 22-million-person rise in the
official poverty numbers between 1972 and 2012.
At the same time, then, that
America’s War on Poverty was putting a spotlight on poor children, the
immigration system was steadily making the problem worse. Between 1999 and 2008
alone, the United States added 1.8 million children to the poverty total; the
Center for Immigration Studies reports that immigrants accounted for 45% of
them.
Latino immigration is of
course not the only reason that the United States has such troubling child-poverty
rates. Other immigrant groups, such as North Africans and Laotians, add to the
ranks of the under-18 poor. And even if we were following the immigration
quotas set in 1924, the United States would be something of an outlier. Perhaps
the nation’s biggest embarrassment is the alarming number of black children
living in impoverished homes, about 3.7 million (compared to 5.1 million poor
Latino kids).
But immigrant poverty belongs
in a different category from black poverty. After all, immigrants voluntarily
come to the United States, usually seeking opportunity. These days, they don’t
always find it.
Yes, some immigrant groups
known for their devotion to their children’s educational attainment (Chinese
immigrants come to mind) have a good shot at middle-class stability, even if
the parents arrive in America with little skill or education. Researchers,
however, have followed several generations of Latinos — again, by far the
largest immigrant group — and what they’ve discovered is not encouraging.
Latino immigrants start off
OK. Raised in the United States, second-generation Latinos go to college at
higher rates than their parents, and they also earn more. Unfortunately, the
third generation either stalls or takes what the Urban Institute calls a “U-turn.”
Between the second and third generation, Latino high school dropout rates go up
and college-going declines. Third-generation
Latinos are more often disconnected — that is, they neither attend school nor
find employment.
::
Other affluent countries have
lots of immigrants struggling to make it in a postindustrial economy. Those
countries have lower child-poverty rates than we do — some much lower. But the
background of the immigrants they accept is very different. Canada is probably
the best comparison. Like the United States, it’s part of the Anglosphere and
is historically multicultural. Unlike the United States, it uses a points
system that considers education levels and English ability, among other skills,
to determine who gets a visa. The Brookings Institution’s Hamilton Project
calculates that 30% of American immigrants have less than a high school
diploma, while 35% have a college degree or higher. Only 22% of Canadian
immigrants lack a high school diploma, while more than 46% have gone to
college.
Sweden presents another
illuminating case. For a long time, the large majority of Sweden’s immigrants
were from Finland, a country with a similar culture and economy. By the 1990s,
the immigrant population began to change as refugees arrived from the former
Yugoslavia, Iran and Iraq — populations far more likely to be unskilled than
immigrants from the European Union. By 2011, Sweden was seeing an explosion in
the number of asylum applicants from Syria, Afghanistan and Africa; in 2015 and
2016, there was another spike. Sweden’s percentage of foreign-born has swelled
to 17% — higher than the approximately 13% in the United States.
How has Sweden handled its growing diversity? Numbers from
earlier this decade suggest that immigrants tend to be poorer than natives and
more likely to fall back into poverty if they do surmount it. In fact, Sweden
has one of the highest poverty rates among immigrants relative to native-born
in the European Union. Most striking, a majority of children living in Sweden
classified as poor in 2010 were immigrants.
Outcomes like these suggest
that immigration optimists have underestimated the difficulty of integrating
the less-educated from undeveloped countries, and their children, into advanced
economies. A more honest accounting raises tough questions. Should the United
States favor higher-skilled immigration? Or do we accept higher levels of child
poverty and lower social mobility as a cost of giving opportunity to people
with none? If we accept such costs, does it make sense to compare our
child-poverty numbers with those of countries such as Sweden, which have only
recently begun to take in large numbers of low-skilled immigrants?
Alternatively, we can fall
back on shouting “racism” every time someone expresses concern about our immigration
system. Remember Nov. 8, 2016, if you want to know how that will play out.
Kay S. Hymowitz is the William E. Simon
Fellow at the Manhattan Institute and a contributing editor of City Journal, from which this essay was
adapted.
More than 52
million Americans live in economically distressed communities
By Sandy English
28 September 2017
A new analysis of Census data shows
that the so-called economic recovery under the Obama administration was an unmitigated
catastrophe for the 20 percent of the American population that live in the
poorest areas of the United States and that gains of jobs and income have gone
overwhelming to the top 20 percent richest areas.
“The 2017 Distressed Communities Report,”
published by the Economic Innovation Group (EIG), analyzes the census data for
2011-2015 for people living in each of the nearly 7,500 American zip codes
according to several criteria.
The EIG’s Distressed Communities Index
(DCI) considers the percentage of the population without a high school diploma,
the percentage of housing vacancies, the percentage of adults working, the
percentage of the population in poverty, the median income ratio (the
percentage of median income that a zip code has for its state), the change in
employment from 2011 to 2015, and the change in the number of businesses in the
same period.
The report divides the findings for zip
codes into five quintiles based on these indicators, rated from worst- to
best-performing: distressed, at risk, mid-tier, comfortable, and prosperous.
The results show that distressed
communities—52.3 million people or 17 percent of the American
population—experienced an average 6 percent drop in the number of adults
working and a 6.3 percent average drop in the number of business
establishments.
“Far from achieving even anemic growth
from 2011 to 2015,” the report notes, “distressed communities instead
experienced what amounts to a deep ongoing recession.”
Further, “fully one third of the
approximately 44 million Americans receiving SNAP (Supplemental Nutrition
Assistance Program or food stamps) and other cash public assistance benefits
(such as Temporary Assistance for Needy Families (TANF)) live in distressed
communities.” The report notes that most distressed communities have seen zero
net job growth since 2000.
Residents in these zip codes are five
times more likely to die than those in prosperous zip codes. Deaths from
cancer, pregnancy complications, suicide, and violence are even higher. “Mental
and substance abuse disorders are 64 percent higher in distressed counties than
prosperous ones, with major clusters in Appalachia and Native American
communities where rates exceed four or five times the national average,” the report
continues.
One other important and alarming fact
which the report highlights is that over a third of the distressed zip codes
contain so-called “brownfield” sites—areas which are polluted or contaminated
in some way. Not only do these have impacts on real estate and business
development, they present a whole array of health hazards to the very poorest
Americans.
Distressed communities can be found all
over the United States but are concentrated in the South: 43 percent of
Mississippi’s zip codes are distressed, followed by Alabama, West Virginia,
Arkansas and Louisiana. According to the report, [the South] “is home to a
staggering 52 percent of all Americans living in distressed zip codes—far above
its 37.5 percent share of the country’s total population.”
After this, the Southwest and Great
Lakes region have the largest share. In the Northeast, most distressed
communities tend to be found in urban areas and in the South, primarily in
rural areas.
The biggest cities with the largest
numbers of distressed zip codes are Cleveland, Ohio, Newark, New Jersey,
Buffalo, New York, Detroit, Michigan and Toledo, Ohio. Mid-sized cities with
the highest number of distressed zip codes include Youngstown, Ohio, Trenton,
New Jersey, Camden, New Jersey, Gary, Indiana, Hartford, Connecticut and Flint,
Michigan.
Urban counties with the highest number
of distressed zip codes include Cook County in Illinois, with Chicago at its
center, Los Angeles County in California, Harris County in Texas, with Houston
at its center, and Wayne County in Michigan, encompassing Detroit. Most of
these urban areas were once industrial centers and home to the industrial
working class.
Distressed zip codes that have a
majority of minorities living in them are more than twice as likely to be distressed
as zip codes that are majority white. “In total,” the report notes, “45 percent
of the country’s majority-minority zip codes are distressed and only 7 percent
of them are prosperous.” At the same time there are numerous distressed
communities that are almost completely white. A quarter of the total distressed
population is under 18.
The report found that the economic
benefits of the recovery after the 2008 recessions have gone to the top
quintile of zip codes, where the wealthier layers of the population live,
including not only the very rich but also the upper middle class.
These areas, which the DCI terms
prosperous, and make up roughly 85 million Americans or 27 percent of the US
population, have for the most part the economic wherewithal to finance higher
levels of education, have the lowest housing vacancy, highest percentage of
working adults, and have had the lion’s share of job and business expansion.
“The job growth rate in the top
quintile was 2.6 times higher than nationally from 2011 to 2015, and business
establishments proliferated three times faster than they did at the national
level,” the report notes. “Prosperous zip codes stand worlds apart from their
distressed counterparts, seemingly insulated from many of the challenges with
which other communities must grapple. The poverty rate is more than 20 points
lower in the average prosperous community than it is in the average distressed
one.”
The report makes much less of an
analysis of the other three, middle quintiles, the at risk, mid-tier, and
comfortable categories, but it does note some trends that address the overall
trends nation-wide. “A remarkably small proportion of places fuel national
increases in jobs and businesses in today’s economy. High growth in these local
economic powerhouses buoys national numbers while obscuring stagnant or
declining economic activity in other parts of the country.”
One of the more telling aspects of the
report is that extreme poverty in the US is presided over by both capitalist
parties: Democratic and Republic politicians have equal numbers of distressed
communities in their constituencies. Democrats, in fact, “represent six of the
10 most distressed congressional districts.”
Another observation from the voting
data, and one of the few that looks at conditions beyond the bottom and top
quintiles, is worth quoting in full:
“President Trump accumulated a 3.5
million vote lead in counties that fell into the bottom three quintiles of
well-being (equivalent to 9.4 percent of all votes cast in these counties). A
vast array of factors determined voting patterns in the 2016 election, but it
stands that the ‘continuity’ candidate performed better in the places
benefiting most from the status quo, while the ‘change’ candidate performed
better in the places one would expect to find more dissatisfaction.”
Broader figures and the historical view
of wealth distribution in the US—that one percent of the population control 40
percent of the wealth or the decades-long decline in the percentage of the
national income that goes to the working class—is not brought out in the report
but the data add to a complete picture of social conditions across the United
States, the character and geographical distribution of social and economic
conditions in a country of more than 320 million.
The portrait provided by the EIG report
is not simply one of increasing misery and poverty for the bottom 20 percent,
and not only one in which only a minority of Americans are achieving anything
like “prosperity,” but of growing and explosive dissent among tens of millions.
It exposes as a bold-faced lie the
claim that President Obama made at the end of his second term, that “things
have never been better” in America.
September
20, 2017
The Awful
Future that Looms for a Majority of Today’s Americans
When it comes to the
future, an overwhelming majority of Americans have adopted a mindset that is a
variation of Isiah 22:12: “Let us eat, drink and be merry for tomorrow does not
matter.” Recently, federal debt surpassed the $20 Trillion mark
(additional state and local debt amount to another $2.9
Trillion). That milestone was
greeted by the Ruling Class and a vast preponderance of the citizenry with a
yawn and a shrug of the shoulder. As the ongoing determination to
promote new entitlement spending and the refusal to rein in, but instead to
expand, existing programs continues unabated.
Any attempt to seriously
discuss the financial fate of the nation is ignored and dismissed with the
proviso that its someone else’s problem for another day down the road. In
reality, this dilemma is not someone else’s problem. The average life
expectancy in the United States today is 79. That means that over 225
million citizens and non-citizens in the country today will still be alive in
30 years.
And what will this nation
be facing 30 years hence? Recently, the Government
Accountability Office as well as a
number of experts such as Price
Waterhouse have projected what that
scenario will be if the country remains on its present course (with no new
entitlements such as single payer health care and government mandated and paid
maternity leave.) Note: All dollar amounts are in 2017 Dollars.
- The dramatic increase
in spending and borrowing combined with the inevitable necessity of
increased tax rates will crowd out private and public investment thereby
slowing the growth of productivity, worker’s wages and the GDP. The
Congressional Budget Office estimates that by 2040 the average annual real
income per person will fall
by $6,000.00. Thus, by 2048 the GDP of the United States will lag
significantly behind China and India, as it falls to third place among the
nations of the world. The U.S. GDP will increase only 76% by 2048
while government spending increases by 142%.
- Concurrent with and
because of the spending, stagnant growth and reduced personal income, the
overall government debt will increase significantly as tax proceeds
(despite eventual higher rates) will not generate anything close to the
revenue necessary to offset spending, as tax revenues to the Federal,
State and local governments will not exceed 30% of the GDP, whereas
spending will absorb 51% of the GDP. By 2048 the overall government
debt (Federal, State and local may well exceed $68 Trillion as compared to
$23 Trillion today. Thus, the interest costs will increase fivefold,
as not only does the debt swell, but the United States will have to appeal
to lenders willing to underwrite a nearly bankrupt nation. Today
this country, with 5% of the world’s population, accounts for over 32%
of Global debt, but by 2048 it will account for 49% of Global
debt. In essence, America will be at the mercy of the rest of the
world and a second-tier economy.
- Over the next 30 years
there will be inevitable recessions, global financial crises and
international military encounters. The United States will,
with this level of debt and spending, find itself in an increasingly
precarious position, as it may not be able to successfully weather any
serious economic downturn or global conflict.
- The above statistics do
not include the current Democratic Party’s love affair with single-payer
healthcare or “Medicare for all.” If that program were included, the
annual government expenditures in 2048 (over and above current healthcare
spending and interest costs) would balloon from $17 Trillion to $20
Trillion (60%
of annual GDP) (and the debt would grow from $68 Trillion to over $86
Trillion.
The tsunami that will
inundate this nation is inevitable as there is no willingness, regardless of
party, to confront these issues.
The Democrats and their
mind-numbed followers, now fully wedded to socialism, have convinced each
other, and unfortunately much of the citizenry, that there is a bottomless pit
of money to be siphoned from the so-called rich and the golden goose that is
Capitalism, the engine of the nation’s GDP, will continue in perpetuity to lay
the gold eggs regardless of any abuse or restraint. The one-time
confiscation of the wealth of all the billionaires in the U.S. would amount to
$2.2 Trillion (less than 31% of all government spending in 2017).
Further, Capitalism cannot thrive without capital and profit, both of which the
Democrats would severely restrict and control, thus, exacerbating the scenario
outlined above.
The Republicans, while
cognizant of the dire future ahead, prefer to hide their heads in the sand and
defer matters to another day and another Congress and another President, as
they are fearful of telling the people the truth and risk losing political
power. Thus, their pre-determined inability and lack of fortitude in addressing
Obamacare or any long-term spending programs.
Donald Trump continues to
tout new programs (such as paid maternity leave), adamantly refuses to address
the out of control entitlement spending, and is content with modified
single-payer health care. He claims that economic growth will take care
of all the problems; however, unless he and his successors find a way to grow
the economy at an annual 5-7% per year for the next 20 to 30 years, that
platitude is meaningless (the highest ten-year period of GDP growth -- 6.7% --
in the past 100 years took place in 1939-1948, which included massive war production for World War II).
President Trump, has no plan or desire to mitigate the disaster looming
on the horizon preferring to kick the can down the road while mouthing the
usual banalities about reining in spending.
Thus, the populace,
instead of being aware of the disaster ahead, is taking its lead from the
Ruling Class. Alternatively, the American people are blithely swimming in
a sea of banalities and faux causes. Whether it is promoting
transgenderism, drowning in cults of personality, defacing and tearing down
statues, feverously looking for supposed racism under every rock, asserting hypothetical
compassion in the promotion of open borders and amnesty for untold millions,
breathlessly endorsing the false God of climate change, cheering for their side
of the political spectrum to humiliate the other, or demanding that government
make their lives better.
I will not be among the
225 million Americans living today that will be alive in 2048. I
have been fortunate to live throughout the golden age of America’s power and
influence, but regrettably to also see the impending end of this glorious and
short-lived era. The true tragedy is that those 225 million refuse
to understand that for them there is no tomorrow to disregard.
When it comes to the
future, an overwhelming majority of Americans have adopted a mindset that is a
variation of Isiah 22:12: “Let us eat, drink and be merry for tomorrow does not
matter.” Recently, federal debt surpassed the $20 Trillion mark
(additional state and local debt amount to another $2.9
Trillion). That milestone was
greeted by the Ruling Class and a vast preponderance of the citizenry with a
yawn and a shrug of the shoulder. As the ongoing determination to
promote new entitlement spending and the refusal to rein in, but instead to
expand, existing programs continues unabated.
Any attempt to seriously
discuss the financial fate of the nation is ignored and dismissed with the proviso
that its someone else’s problem for another day down the road. In
reality, this dilemma is not someone else’s problem. The average life
expectancy in the United States today is 79. That means that over 225
million citizens and non-citizens in the country today will still be alive in
30 years.
And what will this nation
be facing 30 years hence? Recently, the Government
Accountability Office as well as a
number of experts such as Price
Waterhouse have projected what that
scenario will be if the country remains on its present course (with no new
entitlements such as single payer health care and government mandated and paid
maternity leave.) Note: All dollar amounts are in 2017 Dollars.
- The dramatic increase
in spending and borrowing combined with the inevitable necessity of
increased tax rates will crowd out private and public investment thereby
slowing the growth of productivity, worker’s wages and the GDP. The
Congressional Budget Office estimates that by 2040 the average annual real
income per person will fall
by $6,000.00. Thus, by 2048 the GDP of the United States will lag significantly
behind China and India, as it falls to third place among the nations of
the world. The U.S. GDP will increase only 76% by 2048 while
government spending increases by 142%.
- Concurrent with and
because of the spending, stagnant growth and reduced personal income, the
overall government debt will increase significantly as tax proceeds
(despite eventual higher rates) will not generate anything close to the
revenue necessary to offset spending, as tax revenues to the Federal,
State and local governments will not exceed 30% of the GDP, whereas
spending will absorb 51% of the GDP. By 2048 the overall government
debt (Federal, State and local may well exceed $68 Trillion as compared to
$23 Trillion today. Thus, the interest costs will increase fivefold,
as not only does the debt swell, but the United States will have to appeal
to lenders willing to underwrite a nearly bankrupt nation. Today
this country, with 5% of the world’s population, accounts for over 32%
of Global debt, but by 2048 it will account for 49% of Global
debt. In essence, America will be at the mercy of the rest of the
world and a second-tier economy.
- Over the next 30 years
there will be inevitable recessions, global financial crises and
international military encounters. The United States will,
with this level of debt and spending, find itself in an increasingly
precarious position, as it may not be able to successfully weather any
serious economic downturn or global conflict.
- The above statistics do
not include the current Democratic Party’s love affair with single-payer
healthcare or “Medicare for all.” If that program were included, the
annual government expenditures in 2048 (over and above current healthcare
spending and interest costs) would balloon from $17 Trillion to $20
Trillion (60%
of annual GDP) (and the debt would grow from $68 Trillion to over $86
Trillion.
The tsunami that will
inundate this nation is inevitable as there is no willingness, regardless of
party, to confront these issues.
The Democrats and their
mind-numbed followers, now fully wedded to socialism, have convinced each
other, and unfortunately much of the citizenry, that there is a bottomless pit
of money to be siphoned from the so-called rich and the golden goose that is
Capitalism, the engine of the nation’s GDP, will continue in perpetuity to lay
the gold eggs regardless of any abuse or restraint. The one-time
confiscation of the wealth of all the billionaires in the U.S. would amount to
$2.2 Trillion (less than 31% of all government spending in 2017).
Further, Capitalism cannot thrive without capital and profit, both of which the
Democrats would severely restrict and control, thus, exacerbating the scenario
outlined above.
The Republicans, while
cognizant of the dire future ahead, prefer to hide their heads in the sand and
defer matters to another day and another Congress and another President, as
they are fearful of telling the people the truth and risk losing political
power. Thus, their pre-determined inability and lack of fortitude in
addressing Obamacare or any long-term spending programs.
Donald Trump continues to
tout new programs (such as paid maternity leave), adamantly refuses to address
the out of control entitlement spending, and is content with modified
single-payer health care. He claims that economic growth will take care
of all the problems; however, unless he and his successors find a way to grow
the economy at an annual 5-7% per year for the next 20 to 30 years, that
platitude is meaningless (the highest ten-year period of GDP growth -- 6.7% --
in the past 100 years took place in 1939-1948, which included massive war production for World War II).
President Trump, has no plan or desire to mitigate the disaster looming
on the horizon preferring to kick the can down the road while mouthing the
usual banalities about reining in spending.
Thus, the populace,
instead of being aware of the disaster ahead, is taking its lead from the
Ruling Class. Alternatively, the American people are blithely swimming in
a sea of banalities and faux causes. Whether it is promoting
transgenderism, drowning in cults of personality, defacing and tearing down
statues, feverously looking for supposed racism under every rock, asserting
hypothetical compassion in the promotion of open borders and amnesty for untold
millions, breathlessly endorsing the false God of climate change, cheering for
their side of the political spectrum to humiliate the other, or demanding that
government make their lives better.
I will not be among the
225 million Americans living today that will be alive in 2048. I
have been fortunate to live throughout the golden age of America’s power and
influence, but regrettably to also see the impending end of this glorious and
short-lived era. The true tragedy is that those 225 million refuse
to understand that for them there is no tomorrow to disregard.
Read more: http://www.americanthinker.com/articles/2017/09/the_awful_future_that_looms_for_a_majority_of_todays_americans_.html#ixzz4tEUApC4L
Follow us: @AmericanThinker on Twitter | AmericanThinker on Facebook
Rural New York
schools grapple with declining population, increasing poverty
By Jason Melanovski
20 September 2017
A recent report has highlighted the dire development of increasing
poverty and declining enrollment many rural school districts are facing across
New York state, forcing these districts to choose between making onerous cuts,
combining with other districts, or closing schools within the district, thus
forcing students to travel longer distances.
According to a report titled “Demographic Challenges Facing Rural
Schools: Declining Enrollment and Growing Poverty” by the New York State
Association of School Business Officials, the dual phenomena of increased
poverty and lower enrollment are wreaking havoc on local school budgets, which
are primarily funded by local property taxes.
Calling enrollment declines “omnipresent,” the report states that
“96.7 percent of rural school districts had declining enrollment and 84.9
percent had drops of at least ten percent.”
While the rate and overall population in poverty is still higher
in New York’s suburban and urban school districts, the poverty rate in rural
areas is increasing at a noticeably faster pace.
From 2003 to 2015, the poverty rate for school-age children
increased from 14 percent to 18 percent for children in rural school districts
and from 19 percent to 21 percent for children in non-rural school districts.
For both rural and non-rural school districts the greatest jump in poverty
rates occurred between 2009 and 2011 following the 2008 financial crisis.
Another measure of the economic plight of school children is the
percentage of children receiving free or reduced priced lunches. In rural
school districts 48.3 percent of students receive free or reduced priced
lunches, and that number rises to 53.2 percent of students in non-rural
districts. A student is eligible for free or reduced priced lunch when his or
her family makes less than 185 percent of the poverty level.
Although the report was released to shed light on the challenges
facing rural school districts, it made clear that poverty among the state’s
school children has no geographic limits. According the report, “The combination
of poverty and Free- and Reduced-Price Lunch (FRPL) data show that a little
more than one in every five schoolchildren in New York lives in poverty, while
a little more than half of all school children face significant economic
constraints at home.”
The report compiled data from the 340 rural school districts,
which make up about half of those in New York State, but serve only a little
more than 11 percent of the students.
The report noted that the population losses and increases in
poverty cannot be separated from the financial crisis of 2008, stating “for a
few years prior to the onset of the Great Recession, growth rates in urban and
rural counties were closely related. Beginning in 2008, rural populations
entered a period of sustained decline, while urban populations continued to
grow, though their pace of growth slowed after 2011.”
According to United States Census data, the emptying of much of
rural America can be directly connected to the shrinking number of jobs in
non-metro areas, as the rural job market is now 4.26 percent smaller than it
was in 2008.
Speaking to the Daily Star of Oneonta, NY,
the rural Delaware Academy School District’s Superintendent Jason Thomson
stated that the current 47 percent of students who qualify for free or reduced
price meals is the “highest we’ve ever seen.”
In addition, many of the rural counties mentioned in the report
have also been hit hard by the opioid epidemic, claiming the lives of young
workers and reducing an already declining population. Tioga County, for
instance, lost up to 10 percent of its population between 2002 and 2016 and
averaged 16.7 opioid deaths from 2013 to 2015 according to New York state.
With rapidly declining enrollment, rural schools are forced to
count on smaller and smaller budgets with each succeeding school year,
resulting in cuts to classes, teachers, programs and extracurricular activities
and an overall sense of living in a world with scant opportunities for future
life.
As the report states, rural “schools may have to cut back on
valuable academic and enrichment opportunities, from Advanced Placement courses
to music and sports programs, when they no longer have the student numbers
needed for viability. Any potential reductions in college readiness preparation
are incredibly serious. Decreasing enrollment can also increase students’ sense
of isolation as there are literally fewer peers for them to interact with.”
To add to an already dire state of morale in rural schools,
despite the fact that poor rural schools often have significantly higher
graduation rates than poor urban schools, diplomas from rural schools are often
seen as “worthless” according to David Little, executive director of the New
York State Rural Schools Association. Poor rural schools in New York are simply
unable to afford the cost of offering advanced placement (AP) and college-level
coursework that is seen as necessary by college admissions officers.
For its part, the New York state government and the Andrew Cuomo
administration have failed to respond to the demographic and social declines in
rural school districts and increase state aid. The state continues to use a
formula created in 2008, prior to the financial crisis, which categorizes the
majority of rural schools as “average need.” If current demographic and poverty
data were used, the majority of rural schools would now be considered
“high-need,” requiring increased state aid.
Increasing rural poverty is not unique to New York. It has been
rising across the country after falling sharply over many decades to a record
low rate in 2000 of 13.4 percent. 16.7 percent of rural Americans lived in
poverty in 2015, compared to 13 percent in poverty within metropolitan areas,
according to the United States Census Bureau.
US Census report
shows increasing social inequality
By Eric London
15 September 2017
US Census data from 2016 released on Tuesday shows increasing
social inequality amid a small gain in household income that is offset by a
massive growth of personal debt and rising living costs.
The data tracks the ongoing redistribution of wealth from the
working class to the wealthy as a result of the pro-Wall Street policies of
both the Republican and Democratic parties. It substantiates the oligarchic
character of the United States.
Social
inequality
The Gini index, used to measure
social inequality, with higher figures indicating a wider economic divide, rose
slightly from 2015 (.479) to 2016 (.481). The 2016 figure, according to
rankings in the CIA World
Factbook, makes the US slightly more equal than Madagascar and less
equal than Mexico.
In terms of aggregate income share, the shift from 2015 to 2016 is
as follows:
The growth in inequality is even starker when traced from 2007,
the year before the Wall Street crisis.
The data reflects income and not wealth, thereby providing an
incomplete and conservative indication of the scale of inequality. Even within
the highest quintile, the income share increased only for the top 10 percent,
and, in particular, the top 5 percent.
Household
income
The corporate media has portrayed the report as a sign of positive
income growth, since it shows a slight rise in median income of 3.2 percent
from 2015 to 2016.
But according to the Census data, the earnings of “full-time,
year-round workers” remained stagnant. For men in this category, a total of
63.9 million people, earnings declined by 0.4 percent, from $51,859 in 2015 to
$51,640 in 2016. For women in this category, 47.2 million people, there was a
minor increase, 0.7 percent, from $41,257 in 2015 to $41,554 in 2016. In other
words, families with 2 adults working full-time saw a paltry $78 increase in
their yearly earnings from 2015 to 2016.
Claims of rising incomes mask the growth of inequality. The Census
data shows that the household income of the 90th percentile (the 100th being
the highest) was 12.53 times higher than the household income of the 10th
percentile in 2016, up from 12.23 times higher in 2015 and 11.18 times higher
in 2007. The degree to which income is concentrated in the richest 10 percent
of the population is exemplified by the fact that the 5th percentile boasted a
household income 3.82 times higher than the 50th percentile in 2016, up from
3.79 times in 2015 and 3.52 in 2007.
As Bloomberg News reported
Wednesday, “Since 2007, average inflation-adjusted income has climbed more than
10 percent for households in the highest fifth of the earnings distribution,
and it’s fallen 3.2 percent for the bottom quintile. Incomes of the top 5
percent jumped 12.8 percent over the period.”
For the working class, any income increase was transferred to the
corporate elite in the form of rising debt payments and increasing living
expenses, especially for health care.
According to figures from eHealth, a large private health
exchange, average deductibles for families rose 5 percent from 2016 to 2017 (a
year after the period covered by the Census report) and average individual
premiums rose 22 percent over the same period.
The rising cost of student debt alone largely erases income
increases seen by some young people. According to the Census, those aged 15 to
24 saw an income increase of 13.9 percent, from $36,564 in 2015 to $41,655 in
2016, while incomes for young people aged 25 to 34 rose 4.9 percent, from
$58,091 to $60,932, nearly double the percentage increase for older age groups.
However, in 2016, student debt rose to an average of $30,000 per
young person, up 4 percent from 2015, eliminating over 80 percent of the income
rise for 25-34 year olds. For 15 to 24 year olds, the $4,000 increase in median
income would hardly cover one sixth of the average debt payment, let alone make
up for the fact that young people face a future in which they are unlikely to
receive a pension, Social Security or Medicare.
Rising debt levels are not a
phenomenon limited to young people. A Bloomberg report
from August 10 notes that credit card defaults increased from the beginning of
2015—when roughly 2.5 percent of debt holders defaulted—to the end of 2016,
when the total hit 3 percent. This figure subsequently climbed in 2017 to reach
3.49 percent.
Bloomberg notes: “After
deleveraging in the aftermath of the last US recession, Americans have once
again taken on record debt loads that risk holding back the world’s largest
economy... Household debt outstanding--everything from mortgages to credit
cards to car loans--reached $12.7 trillion in the first quarter [2017],
surpassing the previous peak in 2008 before the effect of the housing market
collapse took its toll, Federal Reserve Bank of New York data show.”
“For most Americans,” the report continues, “whose median
household income, adjusted for inflation, is lower than it was at its peak in
1999, borrowing has been the answer to maintaining their standard of living.
The increase in debt helps explain why the economy’s main source of fuel is providing
less of a boost than in the past. Personal spending growth has averaged 2.4
percent since the recession ended in 2009, less than the 3 percent of the
previous expansion and 4.3 percent from 1982-90.”
The Bloomberg report explains
that income from wages minus household debt trended downward in 2015, meaning
that debt is rising faster than wages, causing a loss of roughly $500 billion
across the US economy in the space of just one year.
Poverty
rate
Though the Census report shows that the poverty rate declined from
13.5 percent of households in 2015 to 12.7 percent in 2016, this figure is
substantially higher than the 11.3 percent level that prevailed in 2000. In
reality, individuals and families must make 2.5 to 3 times the official poverty
rate of $12,000 for an individual, $15,500 for a married couple and $25,000 for
a family of four just to make ends meet.
What the data really shows is that the poorest half of the
country--over 150 million people--is in a desperate financial position, with
the next poorest 40 percent facing constant financial strain and a declining
share of the national income. In regard to poverty, the Census Bureau maintains
figures that go up only to 200 percent of the official poverty level. The
latest report shows that 95 million people—29.8 percent of the population—fall
into this category. The share of those under the age of 18 in this category is
much higher--39.1 percent.
This is the context for the drive by the Trump administration and
both big business parties to slash corporate taxes, impose a health care
“reform” that will increase costs for millions of people, and accelerate the
transfer of wealth from the working class to the financial aristocracy.
Census
Bureau: Mens’ Wages Remain Below 1973 Levels
AP Photo/David Goldman
Americans’ median pay packets have
been flat since 1973, even though the vastly expanded federal government has
justified its own salaries and its many massive spending and policy
programs as a sure-fire way to boost education, productivity, and wages.
The
colossal 44-year failure of the federal government to help grow American men’s
wages — or even to reduce poverty rates — is laid bare in the latest
report from the Census Bureau, “Income and Poverty in the United
States: 2016.”
The dense report includes
myriad detailed tables of data around one shocking chart, which reveals no
growth in men’s wages for the past 44 years, or since President Richard Nixon
was beginning his second term in office.
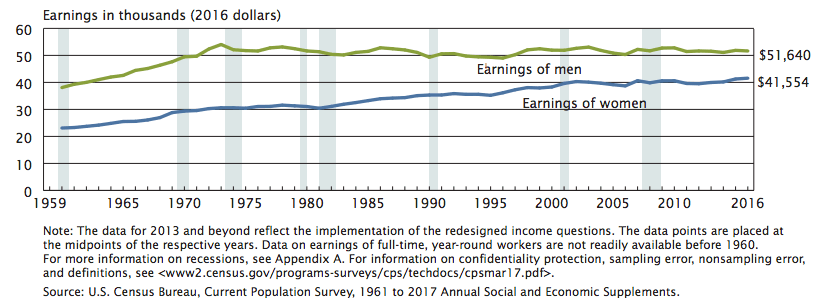
Median earning of full-time, year-round workers, 15 years and
older, 1960 to 2016.
The sudden flatline followed
a 31 percent rise in all men’s median wages from 1960 to 1972.
During the 44-year period
since 1973, income among women grew by roughly 30 percent as more skilled and
trained women entered the market, gained experience, and were promoted to
better-paying jobs. Those opportunities and contributions are good news — but
they do not change the reality that men’s income has been flat for 44 years.
In fact, the report notes
that “the real median earnings of full-time, year-round working men were 1.1
percent lower in 2016 than in 2007.”
There
are many explanations for the flat income, such as the massive growth in the
labor supply when 30 million additional American women and roughly 30 million
immigrants joined in the marketplace competition for good jobs. For example, a
pro-immigration panel at the prestigious National Academies of Science
estimated in 2016 that the huge government-imposed inflow of immigrants
since 1965 has imposed a hidden 5 percent “immigration tax” on Americans’ pay
packets.
Technology has made many
individuals workers more productive but also sidelined many others, such
as newspaper printers and steelworkers. Peaceful international trade has
allowed men to sell more products overseas but also allowed employers to hire
foreign workers instead of Americans. Whatever the combinations of reasons, the
mid-point for men’s income has been flat for 43 years, according to the Census
Bureau.
The flat-earnings chart needs
some explanation:
It shows only
inflation-adjusted, pre-tax pay packets, so it excludes the impact of
inflation, taxes and government benefits, such as food-stamps and tax-breaks
for children, or of Obamacare’s subsidies and spending obligations.
It shows median income, which
is the midpoint of the income scale. Half the people earn above the line, half
the people earn below the line. Average income would be higher, but less
revealing, because a higher share of income is going to the highest earners,
compared to back in the 1970s.
The chart shows the income of
year-round, full-time workers, excluding part-workers or seasonal workers, or
those who work on-and-off under contracts. The chart does not make distinctions
by race.
The chart shows individuals’
income, not the income of households, which has fluctuated as the average
number of children or adults has declined.
The chart only shows income,
but not the quality of goods in the stores, such as Starbucks coffee, cheap
products imported from China, high-tech music players, improved autos or better
health-care. That rise in product quality from competing companies — not
claimed policy improvements from federal agencies — has provided the vast majority
of material gains for Americans amid flat incomes.
The median earnings for all
men employed year-round was $51,640 in 2016, which is still far below the
$54,030 earned by full-time men in 1973. It is also below the $51,938 earned in
the 2000 Internet boom, or the $52,222 earned in the 2007 property bubble when
large-scale legal and illegal immigration provided employers with millions of
alternative imported workers.
The post-1973 reality of flat
income is a huge contrast to the rapid growth from 1960 up to the 1973 oil
shock and the reopened inflow of immigrant labor after 1965. During the
twelves years 1960 to 1972, the median average wages for all males — including
minorities, seasonal workers, and contract workers — rose from by 31 percent,
from $31,926 to $41,013.
When the income of all men is
gauged, the Bureau concluded that all men’s median income in 1973 was $41,935.
It dropped after 1973 and rose back up to $43,360 in 1999 as companies competed
for the few unemployed workers during the first Internet boom. Income crashed
in 2008 to a depression-low of $39,636 in 2012 once the federal government’s
real-estate bubble burst. Since then, income has slowly climbed back to $42,220
in 2016 amid the continuous public protest against the federal government’s
cheap-labor economic strategy, which is exemplified by the bipartisan 2013
“Gang of Eight” amnesty legislation.
Other data in the report
shows that the nation’s poverty rates have barely budged since the 1960s,
although many people in the United States are wealthier than many people n
Europe. For example, the percentage of American said to be in poverty was 11.1
percent in 1973 and 12.7 percent in 2016.
That national poverty rate
climbed, in part, because of the population of Latinos spiked from 10.8 million
in 1973 to 57.6 million in 2016. Poverty among Latinos was 19 percent in
2016, little changed from 1973.
The report also noted that:
The official poverty rate
decreased by 0.8 percentage points between 2015 and 2016. At 12.7 percent, the
2016 poverty rate is not statistically different from 2007 (12.5 percent), the
year before the most recent recession.
In real terms, median
earnings of full-time, year-round working women in 2016 were 2.3 percent higher
than their 2007 median, the year before the most recent recession. The real
median earnings of full-time, year-round working men were 1.1 percent lower in
2016 than in 2007.
In 2017, the number and
percentage of shared households remained higher than in 2007, the year before
the most recent recession. In 2007, 17.0 percent of all households
were shared households, totaling 19.7 million households. In 2017, 19.4
percent of all households were shared households, totaling 24.6 million
households.
OBAMA-CLINTONOMICS to serve the
filthy rich
The same period has seen a massive growth of social
inequality, with income and wealth concentrated at the very top of American
society to an extent not seen since the 1920s.
“This study follows reports released over the past several
months documenting rising mortality rates among US workers due to drug
addiction and suicide, high rates of infant mortality, an overall leveling off
of life expectancy, and a growing gap between the life expectancy of the bottom
rung of income earners compared to those at the top.”
A
'Read-My-Lips' Moment for Trump?
President Donald J. Trump participates a Hurricane Irma briefing
call with FEMA Administrator William "Brock" Long, Monday, Sept. 11,
2017, joined by White House Chief of Staff Gen. John Kelly, left; Homeland
Security and Counter Terrorism Adviser Thomas Bossert, right, and Deputy
Homeland Security Adviser John J. Daly, seated, in the Oval Office at the White
House in Washington, D.C. ( Official White House Photo by Shealah Craighead)
"Having cut a deal with
Democrats for help with the debt ceiling, will Trump seek a deal with Democrats
on amnesty for the 'Dreamers' in return for funding for border security?"
The answer to that question,
raised in my column a week ago, is in. Last night, President Donald Trump cut a
deal with "Chuck and Nancy" for amnesty for 800,000 recipients of the
Deferred Action for Childhood Arrivals program who came here illegally as
youngsters, in return for Democratic votes for more money for border security.
According to preening
Minority Leader Pelosi, the agreement contains not a dime for Trump's Wall, and
the "Dreamers" are to be put on a long glide "path to U.S.
citizenship."
Trump denies this is amnesty,
and says the Wall comes later.
Fallout? Among the most
enthusiastic of
Trump backers, disbelief, disillusionment
and wonderment at where we go from here.
Trump's debt-ceiling deal cut
the legs out from under the GOP budget hawks. But amnesty would pull the rug
out from under all the folks at those rallies who cheered Trump's promise to
preserve the country they grew up in from this endless Third World invasion.
For make no mistake. If
amnesty is granted for the 800,000, that will be but the first wave. "There
are reasons no country has a rule that if you sneak in as a minor you're a
citizen," writes Mickey Kaus, author of "The End of
Equality," in The Washington Post.
"We'd be inviting the
world. ... (An amnesty) would have a knock-on effect. Under 'chain migration'
rules established in 1965 ... new citizens can bring in their siblings and
adult children, who can bring in their siblings and in-laws until whole
villages have moved to the United States.
"(T)oday's 690,000
dreamers would quickly become millions of newcomers who may well be low-skilled
and who would almost certainly include the parents who brought them — the ones
who in theory are at fault."
Trump is risking a breach in
the dam. If the populists who provided him with decisive margins in Ohio,
Wisconsin, Michigan and Pennsylvania feel betrayed, it's hard to blame them.
Why did Trump do it? Clearly,
he relished the cheers he got for the debt ceiling deal and wanted another such
victory. And with the rampant accusations of a lack of "compassion"
for his cancellation of the temporary Obama administration amnesty, he decided
he had had enough heat.
It is not easy to stand up
for long to the gale force winds of hostile commentary that blow constantly
through this city.
Trump's capitulation, if that
is what turns out to be, calls to mind George H. W. Bush's decision in 1990 to
raise the Reagan tax rates in a deal engineered for him by a White House-Hill
coalition, that made a mockery of his "Read my lips! No new taxes!"
pledge of 1988.
For agreeing to feed the
beast of Big Government, rather than cut its rations as Reagan sought to do,
Bush was called a statesman.
By the fall of '92, the
cheering had stopped.
Can Trump not know that those congratulating him for his
newfound flexibility will be rejoicing, should Bob Mueller indict his family
and his friends, and recommend his impeachment down the road?
What makes pre-emptive
amnesty particularly disheartening is that the Trump policy of securing the
border and returning illegal immigrants to their home countries appears, from a
Census Bureau report this week, to be precisely the prescription America needs.
In 2016, paychecks for U.S.
households reached an average of $59,039, up 3.2 percent from 2015, a year when
they had surged.
U.S. median household income
is now at its highest ever.
Yet there are inequalities.
Where the median family income of Asian-Americans is above $81,400, and more
than $65,000 for white Americans, the median family income of Hispanic families
is $47,675, and that of African-American households far less, $39,490.
Consider. Though black
Americans are predominantly native-born, while high percentages of Hispanics
and Asians are immigrants, from the Census numbers, Hispanics earn more and
Asians enjoy twice the median family income of blacks, which is below where it
was in 2000.
Still, black America remains
steadfastly loyal to a party that supports the endless importation of workers
who compete directly for jobs with them and their families. Writes Kaus,
"The median hourly wage (of DACA recipients) is only $15.34, meaning that
many are competing with hard-pressed, lower-skilled Americans."
Looking closer at the Census
Bureau figures, Trumpian economic nationalism would appear to have its greatest
appeal to the American working class, a huge slice of which is native-born,
black and Hispanic.
The elements of that policy?
Secure the border. Halt the
invasion of low-wage workers, here legally and illegally, from the Third World.
Tighten the labor market to force employers to raise wages in our
full-employment economy. Provide tax incentives to companies who site factories
in the USA. Impose border taxes on the products of companies who move plants
abroad.
Put America and American
workers first.
Will any amnesty of
undocumented workers do that?
Patrick J. Buchanan is the
author of a new book, "Nixon's White House Wars: The Battles That Made and
Broke a President and Divided America Forever."
No comments:
Post a Comment