THE DOCTRINE OF THE N.A.F.T.A. GLOBALIST DEMOCRATS IS TO SERVE THE BILLIONAIRE CLASS WITH ENDLESS WAVES OF INVADING 'CHEAP' LABOR SUBSIDIZED WITH WELFARE FUNDED BY TAXES ON MIDDLE AMERICA.
In many speeches, Mayorkas says he is building a mass migration system to deliver workers to wealthy employers and investors and “equity” to poor foreigners. The nation’s border laws are subordinate to elites’ opinion about “the values of our country,” Mayorkas claims.
Billionaires Rupert Murdoch and former New York City Mayor Michael Bloomberg have come out strong for an amnesty plan that could grant U.S. citizenship to more than three million illegal aliens and their family members.
A new amnesty plan by Sen. James Lankford (R-OK) and Sen. Thom Tillis (R-NC) would legalize millions of illegal aliens currently in the U.S. who are shielded by the Obama-created Deferred Action for Childhood Arrivals (DACA) program and others who qualify for the amnesty.
Under Lankford and Tillis’ legislation, known as the Succeed Act, 3.3 million illegal aliens would be eligible for the amnesty, as Migration Policy Institute figures show, and eventually be able to obtain U.S. citizenship.
Current legal immigration law allows naturalized citizens to legally bring foreign family members to the U.S. as well, meaning an amnesty for 3.3 million illegal aliens could result in an overall chain migration upwards of six to eight million foreign nationals.
For Murdoch and Bloomberg’s pro-immigration New American Economy big business organization, the amnesty deal means not only more consumers for corporate interests, but cheaper labor and more stagnant wages as corporate profits look to gain the most from mass immigration.
In a statement by New American Economy President John Feinblatt, the pro-cheap labor group boasted that amnesty for illegal aliens is a “pragmatic approach.”
“This is a pragmatic approach that gets Congress closer to yes on immigration reform,” Feinblatt said. “Talented, hard-working young immigrants brought to our country as children have earned the chance to pursue the American Dream, and it makes economic sense to invest in their futures.”
Murdoch and Bloomberg both launched the group and now serve as co-chairs on the group’s board. The organization’s support of the amnesty deal signals a resounding endorsement from the billionaires. Also on the group’s board is Walt Disney Co. CEO Bob Iger and Marriott International Executive Chairman J.W. Marriott, both of whom have a business stake in importing more foreign workers.
Murdoch and Bloomberg now join the U.S. Chamber of Commerce – which regularly advocates for cheap labor programs – and the GOP mega donors Charles and David Koch in their support for the massive amnesty deal, as Breitbart News reported.
Under an amnesty for illegal aliens, a never-ending flood of chain migration could occur, with potentially upwards of six to eight million foreign nationals coming to the U.S. in the next five years, further driving down wages for America’s working and middle-class.
There are four pipelines for which multinational corporations use to import cheaper foreign workers in order to flood the domestic labor supply. Those options include low-wage legal immigrants who come to the U.S. for work; non-immigrants who come to the U.S. on any of the employment-based visa programs available; foreign nationals who are allowed to work legally on Employment Authorization Documents (EAD) – like those given temporary amnesty through DACA; and illegal aliens who enter the U.S. mostly through the U.S.-Mexico border.
John Binder is a reporter for Breitbart News. Follow him on Twitter at @JxhnBinder
Zuckerberg’s Open Borders Group Praises GOP Amnesty Push
Facebook CEO Mark Zuckerberg’s open borders organization says it is “critical” that Congress pass Republican legislation to give amnesty to millions of illegal aliens.
FWD.us, a pro-amnesty, pro-foreign labor organization funded by Silicon Valley leaders like Zuckerberg, Microsoft co-founder Bill Gates, and former Microsoft CEO Steve Ballmer–is backing the GOP establishment’s latest effort to legalize at least 3.3 million illegal aliens.
In a new bill by Sen. Thom Tillis (R-NC) and Rep. James Lankford (R-OK) titled the SUCCEED Act, illegal aliens younger than 16-years-old who entered the U.S. before 2012 can apply for U.S. citizenship. Although Tillis and Lankford claim amnesty would only include up to one million illegal aliens, the latest research from the Migration Policy Institute finds that at least 3.3 million illegal aliens would fit the proposed criteria.
The open borders lobby and some corporate interests through Zuckerberg’s FWD.us organization are cheering the plan, with the group’s President Todd Schulte saying he is “encouraged” by the GOP framework.
“No legislation is perfect, but it is critical that any bill that makes its way to the President’s desk ensures due process protections for these hardworking young people, and includes a reasonable pathway to citizenship,” Schulte said in a statement. “We need to be clear that talk and assurances mean nothing without a law signed into place, and we urge every single member of Congress to cosponsor bipartisan legislation to protect Dreamers without delay.”
While the open borders lobby and corporate interests back the amnesty legislation, immigration lawyers are taking a more skeptical approach, saying that the bill does not go far enough in terms of chain migration for extended families.
Zuckerberg’s FWD.us has been one of the major backers of all the latest efforts to give U.S. citizenship to millions of illegal aliens. Most recently, as Breitbart Texas reported, the group praised the resurrection of the DREAM Act, which would allow for millions to permanently stay in the U.S., while also creating surges at the U.S-Mexico Border and spikes in chain migration.
John Binder is a reporter for Breitbart Texas. Follow him on Twitter at @JxhnBinder.
THE MEXICAN INVASION, OCCUPATION AND LOOTING IN AMERICA'S OPEN BORDERS:
More than 52 million Americans live in economically distressed communities
By Sandy English 28 September 2017
A new analysis of Census data shows that the so-called economic recovery under the Obama administration was an unmitigated catastrophe for the 20 percent of the American population that live in the poorest areas of the United States and that gains of jobs and income have gone overwhelming to the top 20 percent richest areas.
“The 2017 Distressed Communities Report,” published by the Economic Innovation Group (EIG), analyzes the census data for 2011-2015 for people living in each of the nearly 7,500 American zip codes according to several criteria.
The EIG’s Distressed Communities Index (DCI) considers the percentage of the population without a high school diploma, the percentage of housing vacancies, the percentage of adults working, the percentage of the population in poverty, the median income ratio (the percentage of median income that a zip code has for its state), the change in employment from 2011 to 2015, and the change in the number of businesses in the same period.
The report divides the findings for zip codes into five quintiles based on these indicators, rated from worst- to best-performing: distressed, at risk, mid-tier, comfortable, and prosperous.
The results show that distressed communities—52.3 million people or 17 percent of the American population—experienced an average 6 percent drop in the number of adults working and a 6.3 percent average drop in the number of business establishments.
“Far from achieving even anemic growth from 2011 to 2015,” the report notes, “distressed communities instead experienced what amounts to a deep ongoing recession.”
Further, “fully one third of the approximately 44 million Americans receiving SNAP (Supplemental Nutrition Assistance Program or food stamps) and other cash public assistance benefits (such as Temporary Assistance for Needy Families (TANF)) live in distressed communities.” The report notes that most distressed communities have seen zero net job growth since 2000.
Residents in these zip codes are five times more likely to die than those in prosperous zip codes. Deaths from cancer, pregnancy complications, suicide, and violence are even higher. “Mental and substance abuse disorders are 64 percent higher in distressed counties than prosperous ones, with major clusters in Appalachia and Native American communities where rates exceed four or five times the national average,” the report continues.
One other important and alarming fact which the report highlights is that over a third of the distressed zip codes contain so-called “brownfield” sites—areas which are polluted or contaminated in some way. Not only do these have impacts on real estate and business development, they present a whole array of health hazards to the very poorest Americans.
Distressed communities can be found all over the United States but are concentrated in the South: 43 percent of Mississippi’s zip codes are distressed, followed by Alabama, West Virginia, Arkansas and Louisiana. According to the report, [the South] “is home to a staggering 52 percent of all Americans living in distressed zip codes—far above its 37.5 percent share of the country’s total population.”
After this, the Southwest and Great Lakes region have the largest share. In the Northeast, most distressed communities tend to be found in urban areas and in the South, primarily in rural areas.
The biggest cities with the largest numbers of distressed zip codes are Cleveland, Ohio, Newark, New Jersey, Buffalo, New York, Detroit, Michigan and Toledo, Ohio. Mid-sized cities with the highest number of distressed zip codes include Youngstown, Ohio, Trenton, New Jersey, Camden, New Jersey, Gary, Indiana, Hartford, Connecticut and Flint, Michigan.
Urban counties with the highest number of distressed zip codes include Cook County in Illinois, with Chicago at its center, Los Angeles County in California, Harris County in Texas, with Houston at its center, and Wayne County in Michigan, encompassing Detroit. Most of these urban areas were once industrial centers and home to the industrial working class.
Distressed zip codes that have a majority of minorities living in them are more than twice as likely to be distressed as zip codes that are majority white. “In total,” the report notes, “45 percent of the country’s majority-minority zip codes are distressed and only 7 percent of them are prosperous.” At the same time there are numerous distressed communities that are almost completely white. A quarter of the total distressed population is under 18.
The report found that the economic benefits of the recovery after the 2008 recessions have gone to the top quintile of zip codes, where the wealthier layers of the population live, including not only the very rich but also the upper middle class.
These areas, which the DCI terms prosperous, and make up roughly 85 million Americans or 27 percent of the US population, have for the most part the economic wherewithal to finance higher levels of education, have the lowest housing vacancy, highest percentage of working adults, and have had the lion’s share of job and business expansion.
“The job growth rate in the top quintile was 2.6 times higher than nationally from 2011 to 2015, and business establishments proliferated three times faster than they did at the national level,” the report notes. “Prosperous zip codes stand worlds apart from their distressed counterparts, seemingly insulated from many of the challenges with which other communities must grapple. The poverty rate is more than 20 points lower in the average prosperous community than it is in the average distressed one.”
The report makes much less of an analysis of the other three, middle quintiles, the at risk, mid-tier, and comfortable categories, but it does note some trends that address the overall trends nation-wide. “A remarkably small proportion of places fuel national increases in jobs and businesses in today’s economy. High growth in these local economic powerhouses buoys national numbers while obscuring stagnant or declining economic activity in other parts of the country.”
One of the more telling aspects of the report is that extreme poverty in the US is presided over by both capitalist parties: Democratic and Republic politicians have equal numbers of distressed communities in their constituencies. Democrats, in fact, “represent six of the 10 most distressed congressional districts.”
Another observation from the voting data, and one of the few that looks at conditions beyond the bottom and top quintiles, is worth quoting in full:
“President Trump accumulated a 3.5 million vote lead in counties that fell into the bottom three quintiles of well-being (equivalent to 9.4 percent of all votes cast in these counties). A vast array of factors determined voting patterns in the 2016 election, but it stands that the ‘continuity’ candidate performed better in the places benefiting most from the status quo, while the ‘change’ candidate performed better in the places one would expect to find more dissatisfaction.”
Broader figures and the historical view of wealth distribution in the US—that one percent of the population control 40 percent of the wealth or the decades-long decline in the percentage of the national income that goes to the working class—is not brought out in the report but the data add to a complete picture of social conditions across the United States, the character and geographical distribution of social and economic conditions in a country of more than 320 million. The portrait provided by the EIG report is not simply one of increasing misery and poverty for the bottom 20 percent, and not only one in which only a minority of Americans are achieving anything like “prosperity,” but of growing and explosive dissent among tens of millions.
It exposes as a bold-faced lie the claim that President Obama made at the end of his second term, that “things have never been better” in America.
The conversation surrounding illegal immigration is deeply personal for many people -- it is emotionally-charged and politically divisive. Debates often devolve into mud-slinging contests, and arguments morph into feigned outrage, even violent protests. But from an economic perspective the question is settled science: illegal aliens cost taxpayers billions, impoverish American workers, and are completely unnecessary for America’s economic success.
To begin with, illegal immigrants are expensive. According to the Federation for American Immigration Reform’s 2017 report, illegal immigrants, and their children, cost American taxpayers a net $116 billion annually -- roughly $7,000 per alien annually. While high, this number is not an outlier: a recent study by theHeritage Foundation found that low-skilled immigrants (including those here illegally) cost Americans trillions over the course of their lifetimes, and a study from the National Economics Editorial found that illegal immigration costs America over $140 billion annually. As it stands, illegal immigrants are a massive burden on American taxpayers.
Although border control is a federal responsibility, state and local governments shoulder two-thirds of the costs associated with illegal immigration. Unsurprisingly, this costs California more than any other state: California spends$30.3 billion on illegal aliens annually -- 17.7 percent of the state budget. Texas is next: illegal immigration costs the State of Texas $12.4 billion annually, or roughly 10 percent of the state's budget. In third place is New York, which spends $7.4 billion on illegal immigration.
Of course, the tax burden is only part of the story: illegal immigration also distorts the labor market, hurting American workers. Ever hear of the law of supply and demand? It is how the free market determines prices: when demand increases, prices increase (more people bid-up the price); conversely, when supply increases, prices decrease (less scarcity means less urgency), and vice versa. Supply and demand underpins the price of everything from gasoline, to apples, to the value of a person’s labor -- surgeons command high prices because there is a limited supply of surgeons, whereas store clerks make minimum wage because anyone can be a store clerk.
According to Pew Research, illegal immigration has flooded America’s labor market with at least 12 million new workers. This has dramatically, and rapidly increased the labor supply and therefore decreased wages for American workers. Ample evidence supports this claim. For example, before Hurricane Harvey, President Trump’s crackdown on illegal aliens had already caused wages for construction workers to rise by 30 percent in Texas (half of Texas’ construction workers were illegal aliens). Likewise,businesses in Maine were forced to hire American workers after the availability of visas for temporary foreign workers were restricted. As a result, unemployment decreased, wages increased, and working conditions improved in order to attract American workers. Illegal labor has distorted America’s labor markets, and hurt American workers in the process.
Finally, America’s economy will not collapse without easy access to illegal labor.
The standard refrain can be summed up as: “we need illegals to do the jobs Americans won’t do.” This is nonsense for two reasons. First, the claim is predicated upon the false assumption that America’s labor market is saturated and requires more workers to continue growing. This could not be further from the truth: right now fewer that 150 million Americans (out of 320 million) are employed, likewise there are 23 million Americans currently looking for work -- twice the number of illegal aliens in the country. Even assuming that every illegal aliens was employed, replacing them with American workers would still leave 11 million Americans unemployed.
Second, the claim is undermined by actual labor statistics. According to theBureau of Labor Statistics, millions of Americans -- of all races -- currently work as janitors, laborers, and agricultural workers. In fact, only four percent of American agricultural workers are illegal aliens, according to a report in theNational Review, putting to bed the myth that we would starve without illegal laborers. Clearly Americans are willing to work any job, provided they are compensated at fair market value -- this is not currently happening precisely because many illegals work under-the-table.
Believe it or not, states without illegal immigrants, like Montana or Ohio, are not economic backwaters with exorbitantly high costs of living -- people in Idaho can still afford McDonald’s and Starbucks, they just pay teenagers to work the drive-thrus. In fact, the cost of living in said states is often cheaper, because their governments do not require high taxes to subsidize legions of illegal aliens.
It is also worth mentioning that America is the only developed nation, until very recently, that imports millions of illegal immigrants to work in its service sector -- other rich nations like Japan and Canada, do not. Yet despite this, the GDP per capita of Japan has actually grown faster than America’s during the same period. The same is true of Canada and Australia. If illegal immigration is such an economic bonanza, why are Americans being left behind by nations without this “advantage”?
University professors, Silicon Valley CEOs, and politicians are not losing their jobs to illegals -- ordinary folk are. Illegal immigration is a contentious issue, but it remains important to couch policy discussions in facts -- not just abstract principles.
The Cost of Illegal Immigration to Taxpayers is Growing at an Unsustainable Pace
By Spencer Raley
The Hill, September 28, 2017
The majority of the costs to taxpayers, $89 billion (66 percent), are borne at the local and state level. This means that American taxpayers are forced to bear the costs of the federal government’s failure to secure our borders every time they pay school taxes, local tolls, sales and excise taxes. It also means that illegal migrants get a lot of benefits that they don’t pay for.
Conversely, by a 5-to-1 ratio, the taxes paid by illegal immigrants wind up in federal coffers. Despite states bearing most of the costs associated with illegal immigration, the federal government receives 15.4 billion of their tax receipts, compared to $3.5 billion received by states and localities.
On his Fox News show last week, Tucker Carlson took on the illegal immigrants who shouted down House Democratic leader Nancy Pelosi at her press conference, saying most are “benefiting in a lot of ways from U.S. society, which is the richest in the world.”
“I never hear a single person say thank you. Why not?” he asked his guest, an illegal immigrant activist.
DACA renewal deadline looms; concerns linger
WESH - Orlando, FL
On a Facebook page called DACA Dreamers Only, several young adults who are in DACA insist they’ve worked for everything they’ve gotten, and haven’t received any government handouts.
“All day long I hear ppl say 'illegals get free health insurance, Medicaid, food stamps, welfare.' Anyone's state gives out free welfare services? I know mine don't," one person wrote.
“It is common knowledge that we can’t take advantage of many of the programs such as welfare and Medicare, yet many believe that we do. We are not taking advantage of anyone and all we want is a chance,” another one wrote.
But illegal immigrants do get several kinds of welfare, much of it through their U.S.-born children, and a study by the Center for Immigration Studies showed that 62 percent of households headed by an illegal immigrant received some type of welfare. In addition, U.S. taxpayers have spent billions of dollars a year for K-12 education for illegal immigrants, about 690,000 of whom have qualified for DACA — Deferred Action for Childhood Arrivals.
The Trump administration rescinded the DACA program this month, but with a six-month wind-down period to give Congress a chance to pass a version of the DREAM Act, which would give legal status to all those eligible for DACA and other illegal immigrants who meet certain criteria, and allow them to apply to become citizens after a few years.
But how much have U.S. taxpayers spent on the DACA beneficiaries so far? How many benefits have DACA people collected while in the U.S. illegally?
The biggest benefit illegal immigrants in DACA have gotten by far is a K-12 education in American schools, with extra services provided to them for ELL (English Language Learner) programs, and other programs offered through schools that include school lunch, school breakfast, in many places, summer meals, and reduced or free after-care and summer camp. The total school-related benefits amount to the year-round care and feeding of hundreds of thousands of children whose parents are living and working in the country illegally.
The average per pupil cost of K-12 education in public schools in America is over $12,000, according to the National Center for Education Statistics. But more is spent, on average, on immigrant children.
According to the Federation for American Immigration Enforcement, the cost to educate ELL students who have limited English-language ability is, on average, 20 percent higher than for regular students. In some school districts, it’s as much as 50 percent higher.
ELL costs nationwide totaled 59.8 billion in 2016.
“The brunt of these costs consist of providing salaries, benefits and/or training to hundreds of thousands of LEP teachers and programs, followed by additional funding for tutoring, bilingual textbooks and material, additional administrative tasks and facility enlargement/enhancement needed to incorporate the increased number of students,” wrote the authors of the 2016 FAIR report “Elephant in the Classroom: Mass Immigration’s Impact on Public Education."
As of September 4, there are 689,800 people in DACA. They are between the ages of 15 and 36. The largest group of them — 253,000 — are between the ages of 21 and 25, according to the U.S. Citizenship and Immigration Service. A total of 65 percent of DACA recipients are 25 or under. The great majority are originally from Mexico.
To qualify for DACA, a person had to have resided in the U.S. continuously since 2007, and had to be enrolled in either school or a training program or have graduated from high school.
According to U.S. Citizenship and Immigration Services, 253,100 DACA recipients are 21 to 25 years old, and would have therefore attended four years at an American high school. Another 196,500 DAC recipients are now 16-20 years old and therefore would have gone to an American school for at least eight years. An additional 2,000 DAC recipients are under 16, and would have spent at least 10 years in American schools. Multiplying the numbers by $12,000 per pupil per year brings the cost to about $31.25 billion — which is the most conservative estimate — and is likely to be underestimating the amount that U.S. taxpayers have paid for schooling for DACA recipients.
Government Benefits Collected by DACA Recipients
K-12 Education
$31.25 billion
School lunches
$20 billion
Welfare
$30 billion
Source: LifeZette
This is not counting free school meals.
Harvard University researcher Roberto Gonzales found in a study of DACA recipients that 73 percent qualified for free lunch in high school, based on their low family income.
In 2016 the U.S. spent $18 billion on the school lunch program, double the $7.5 billion that it had spent in 2000. The dramatic increase is thought to be due largely to the increase in the number of children in U.S. schools where are either illegal immigrants or the children of illegal immigrants.
Another huge benefit the illegal aliens now in DACA have collected is in-state tuition at public universities and colleges in the 21 states that now offer in-state tuition for undocumented students.
DACA recipients might not consider that a benefit — but on average, people paying in-state tuition are only paying about a third of the total cost of their education, with the rest paid for by the state.
“If you’re only covering about a third of the tuition yourself, then somebody else is paying for the rest. Taxpayers,” said Ira Mehlman, spokesman for FAIR.
“It’s a huge government benefit,” he told LifeZette. “Most government benefits don’t come in the form of a check with your name on it.”
And setting aside education, a lot of illegal immigrants are receiving actual welfare, often through their children. But not always.
WIC, the food program that provides coupons for free food to women and their children, does not require a person to be a U.S. citizen to qualify.
A study by Steven Camarota of the Center for Immigration Studies showed that 62 percent of all households headed by an illegal immigrant got some kind of welfare. Almost 23 percent of them got WIC and more than 22 percent of them got food stamps (EBT) — most through their U.S.-born children.
In addition, almost all pre-natal care and births by illegal immigrants in the U.S. are covered by Medicaid, as the beneficiary is considered to be the future U.S. citizen who is to be born.
Jason Richwine and Robert Rector estimated in a 2013 report for the Heritage Foundation that in 2010, the average household headed by an illegal immigrant household received close to $25,000 in government benefits and paid, on average, about $10,00 in taxes, a deficit of about $14,000 per household.
So how much have DACA recipients collected in welfare and other benefits paid for by U.S. taxpayers? Likely more than $100 billion in benefits, including K-12 education, school lunches and actual welfare (WIC, food stamps, Medicaid, etc.).
But as government numbers are not available, it is almost impossible to know exactly how much illegal immigrants who now have DACA have benefited from being in the U.S. illegally.
“They should be looking at it, but they’re not,” said Jessica Vaughan of the Center for Immigration Studies, referring to the federal government.
An email query to U.S. Citizenship and Immigration Services for information about government expenditures on DACA recipients was not answered on Monday.
(photo credit, homepage and article images: Molly Adams,
JUDICIAL WATCH:
“The greatest criminal threat to the daily lives of
“Mexican drug cartels are the “other” terrorist threat to America. Militant Islamists have the goal of destroying the United States.Mexican drug cartels are now accomplishing that mission – from within, every day, in virtually every community across this country.” JUDICIAL WATCH
EXCLUSIVE PHOTOS:
Another Clandestine Cartel Crematorium Discovered near Texas Border
REYNOSA, Tamaulipas — Mexican authorities continue looking into the discovery of a clandestine human incineration operation where the Gulf Cartel burned the bodies of their victims.
The discovery occurred when neighbors of the Revolucion Obrera neighborhood complained of weird smells and the suspicion that a house was being used to burn bodies. Authorities arrived at the location and found that regular home was a cartel crematorium.
Inside the house, forensic investigators with the Tamaulipas Attorney General’s Office discovered various corpses and body parts in stages of incineration and decomposition. Some of the human remains were only superficially incinerated, while others were mostly turned into charred ashes.
The discovery comes as two rival factions of the Gulf Cartel continue fighting for control of this city. Since early May, the factions carried out hundreds of kidnappings, drive-by attacks, and more than 190 confirmed murders; however, the real numbers could actually be much higher.
One of the strategies used by both factions of the Gulf Cartel involves the kidnapping of lookouts, foot soldiers, and street-level dealers. As Breitbart Texas has reported, these victims are often tortured and murdered with their bodies either being dumped in shallow, clandestine grave sites or are incinerated.
Editor’s Note: Breitbart Texas traveled to the Mexican States of Tamaulipas, Coahuila, and Nuevo León to recruit citizen journalists willing to risk their lives and expose the cartels silencing their communities. The writers would face certain death at the hands of the various cartels that operate in those areas including the Gulf Cartel and Los Zetas if a pseudonym were not used. Breitbart Texas’ Cartel Chronicles are published in both English and in their original Spanish. This article was written by “A.C. Del Angel” from Tamaulipas.
September 20, 2017
The Awful Future that Looms for a Majority of Today’s Americans
When it comes to the future, an overwhelming majority of Americans have adopted a mindset that is a variation of Isiah 22:12: “Let us eat, drink and be merry for tomorrow does not matter.” Recently, federal debt surpassed the $20 Trillion mark (additional state and local debt amount to another $2.9 Trillion). That milestone was greeted by the Ruling Class and a vast preponderance of the citizenry with a yawn and a shrug of the shoulder. As the ongoing determination to promote new entitlement spending and the refusal to rein in, but instead to expand, existing programs continues unabated.
Any attempt to seriously discuss the financial fate of the nation is ignored and dismissed with the proviso that its someone else’s problem for another day down the road. In reality, this dilemma is not someone else’s problem. The average life expectancy in the United States today is 79. That means that over 225 million citizens and non-citizens in the country today will still be alive in 30 years.
And what will this nation be facing 30 years hence? Recently, the Government Accountability Office as well as a number of experts such as Price Waterhouse have projected what that scenario will be if the country remains on its present course (with no new entitlements such as single payer health care and government mandated and paid maternity leave.) Note: All dollar amounts are in 2017 Dollars.
A.Federal, State and local government spending currently amounts to $7 Trillion per year or 37% of the nation’s Gross Domestic Product (GDP). By 2048 these entities combined will be spending in excess of $17 Trillion per year, or over 50% of GDP. As interest costs on the overall debt will increase from $0.4 Trillion to $2.4 Trillion, healthcare spending (includes Obamacare subsidies) will vault from $1.6 Trillion to $3.7 Trillion, Social Security and pension payments will grow from $1.4 Trillion to $3.5 Trillion, education spending from $1 Trillion to $2.4 Trillion, and welfare programs from $0.5 Trillion to $1.3 Trillion.
B.The dramatic increase in spending and borrowing combined with the inevitable necessity of increased tax rates will crowd out private and public investment thereby slowing the growth of productivity, worker’s wages and the GDP. The Congressional Budget Office estimates that by 2040 the average annual real income per person will fall by $6,000.00. Thus, by 2048 the GDP of the United States will lag significantly behind China and India, as it falls to third place among the nations of the world. The U.S. GDP will increase only 76% by 2048 while government spending increases by 142%.
C.Concurrent with and because of the spending, stagnant growth and reduced personal income, the overall government debt will increase significantly as tax proceeds (despite eventual higher rates) will not generate anything close to the revenue necessary to offset spending, as tax revenues to the Federal, State and local governments will not exceed 30% of the GDP, whereas spending will absorb 51% of the GDP. By 2048 the overall government debt (Federal, State and local may well exceed $68 Trillion as compared to $23 Trillion today. Thus, the interest costs will increase fivefold, as not only does the debt swell, but the United States will have to appeal to lenders willing to underwrite a nearly bankrupt nation. Today this country, with 5% of the world’s population, accounts for over 32% of Global debt, but by 2048 it will account for 49% of Global debt. In essence, America will be at the mercy of the rest of the world and a second-tier economy.
D.Over the next 30 years there will be inevitable recessions, global financial crises and international military encounters. The United States will, with this level of debt and spending, find itself in an increasingly precarious position, as it may not be able to successfully weather any serious economic downturn or global conflict.
E.The above statistics do not include the current Democratic Party’s love affair with single-payer healthcare or “Medicare for all.” If that program were included, the annual government expenditures in 2048 (over and above current healthcare spending and interest costs) would balloon from $17 Trillion to $20 Trillion (60% of annual GDP) (and the debt would grow from $68 Trillion to over $86 Trillion.
The tsunami that will inundate this nation is inevitable as there is no willingness, regardless of party, to confront these issues.
The Democrats and their mind-numbed followers, now fully wedded to socialism, have convinced each other, and unfortunately much of the citizenry, that there is a bottomless pit of money to be siphoned from the so-called rich and the golden goose that is Capitalism, the engine of the nation’s GDP, will continue in perpetuity to lay the gold eggs regardless of any abuse or restraint. The one-time confiscation of the wealth of all the billionaires in the U.S. would amount to $2.2 Trillion (less than 31% of all government spending in 2017). Further, Capitalism cannot thrive without capital and profit, both of which the Democrats would severely restrict and control, thus, exacerbating the scenario outlined above.
The Republicans, while cognizant of the dire future ahead, prefer to hide their heads in the sand and defer matters to another day and another Congress and another President, as they are fearful of telling the people the truth and risk losing political power. Thus, their pre-determined inability and lack of fortitude in addressing Obamacare or any long-term spending programs.
Donald Trump continues to tout new programs (such as paid maternity leave), adamantly refuses to address the out of control entitlement spending, and is content with modified single-payer health care. He claims that economic growth will take care of all the problems; however, unless he and his successors find a way to grow the economy at an annual 5-7% per year for the next 20 to 30 years, that platitude is meaningless (the highest ten-year period of GDP growth -- 6.7% -- in the past 100 years took place in 1939-1948, which included massive war production for World War II). President Trump, has no plan or desire to mitigate the disaster looming on the horizon preferring to kick the can down the road while mouthing the usual banalities about reining in spending.
Thus, the populace, instead of being aware of the disaster ahead, is taking its lead from the Ruling Class. Alternatively, the American people are blithely swimming in a sea of banalities and faux causes. Whether it is promoting transgenderism, drowning in cults of personality, defacing and tearing down statues, feverously looking for supposed racism under every rock, asserting hypothetical compassion in the promotion of open borders and amnesty for untold millions, breathlessly endorsing the false God of climate change, cheering for their side of the political spectrum to humiliate the other, or demanding that government make their lives better.
I will not be among the 225 million Americans living today that will be alive in 2048. I have been fortunate to live throughout the golden age of America’s power and influence, but regrettably to also see the impending end of this glorious and short-lived era. The true tragedy is that those 225 million refuse to understand that for them there is no tomorrow to disregard.
Rural New York schools grapple with declining population, increasing poverty
By Jason Melanovski 20 September 2017
A recent report has highlighted the dire development of increasing poverty and declining enrollment many rural school districts are facing across New York state, forcing these districts to choose between making onerous cuts, combining with other districts, or closing schools within the district, thus forcing students to travel longer distances.
According to a report titled “Demographic Challenges Facing Rural Schools: Declining Enrollment and Growing Poverty” by the New York State Association of School Business Officials, the dual phenomena of increased poverty and lower enrollment are wreaking havoc on local school budgets, which are primarily funded by local property taxes.
Calling enrollment declines “omnipresent,” the report states that “96.7 percent of rural school districts had declining enrollment and 84.9 percent had drops of at least ten percent.”
While the rate and overall population in poverty is still higher in New York’s suburban and urban school districts, the poverty rate in rural areas is increasing at a noticeably faster pace.
From 2003 to 2015, the poverty rate for school-age children increased from 14 percent to 18 percent for children in rural school districts and from 19 percent to 21 percent for children in non-rural school districts. For both rural and non-rural school districts the greatest jump in poverty rates occurred between 2009 and 2011 following the 2008 financial crisis.
Another measure of the economic plight of school children is the percentage of children receiving free or reduced priced lunches. In rural school districts 48.3 percent of students receive free or reduced priced lunches, and that number rises to 53.2 percent of students in non-rural districts. A student is eligible for free or reduced priced lunch when his or her family makes less than 185 percent of the poverty level.
Although the report was released to shed light on the challenges facing rural school districts, it made clear that poverty among the state’s school children has no geographic limits. According the report, “The combination of poverty and Free- and Reduced-Price Lunch (FRPL) data show that a little more than one in every five schoolchildren in New York lives in poverty, while a little more than half of all school children face significant economic constraints at home.”
The report compiled data from the 340 rural school districts, which make up about half of those in New York State, but serve only a little more than 11 percent of the students.
The report noted that the population losses and increases in poverty cannot be separated from the financial crisis of 2008, stating “for a few years prior to the onset of the Great Recession, growth rates in urban and rural counties were closely related. Beginning in 2008, rural populations entered a period of sustained decline, while urban populations continued to grow, though their pace of growth slowed after 2011.”
According to United States Census data, the emptying of much of rural America can be directly connected to the shrinking number of jobs in non-metro areas, as the rural job market is now 4.26 percent smaller than it was in 2008.
Speaking to the Daily Star of Oneonta, NY, the rural Delaware Academy School District’s Superintendent Jason Thomson stated that the current 47 percent of students who qualify for free or reduced price meals is the “highest we’ve ever seen.”
In addition, many of the rural counties mentioned in the report have also been hit hard by the opioid epidemic, claiming the lives of young workers and reducing an already declining population. Tioga County, for instance, lost up to 10 percent of its population between 2002 and 2016 and averaged 16.7 opioid deaths from 2013 to 2015 according to New York state.
With rapidly declining enrollment, rural schools are forced to count on smaller and smaller budgets with each succeeding school year, resulting in cuts to classes, teachers, programs and extracurricular activities and an overall sense of living in a world with scant opportunities for future life.
As the report states, rural “schools may have to cut back on valuable academic and enrichment opportunities, from Advanced Placement courses to music and sports programs, when they no longer have the student numbers needed for viability. Any potential reductions in college readiness preparation are incredibly serious. Decreasing enrollment can also increase students’ sense of isolation as there are literally fewer peers for them to interact with.”
To add to an already dire state of morale in rural schools, despite the fact that poor rural schools often have significantly higher graduation rates than poor urban schools, diplomas from rural schools are often seen as “worthless” according to David Little, executive director of the New York State Rural Schools Association. Poor rural schools in New York are simply unable to afford the cost of offering advanced placement (AP) and college-level coursework that is seen as necessary by college admissions officers.
For its part, the New York state government and the Andrew Cuomo administration have failed to respond to the demographic and social declines in rural school districts and increase state aid. The state continues to use a formula created in 2008, prior to the financial crisis, which categorizes the majority of rural schools as “average need.” If current demographic and poverty data were used, the majority of rural schools would now be considered “high-need,” requiring increased state aid.
Increasing rural poverty is not unique to New York. It has been rising across the country after falling sharply over many decades to a record low rate in 2000 of 13.4 percent. 16.7 percent of rural Americans lived in poverty in 2015, compared to 13 percent in poverty within metropolitan areas, according to the United States Census Bureau.
US Census report shows increasing social inequality
By Eric London 15 September 2017
US Census data from 2016 released on Tuesday shows increasing social inequality amid a small gain in household income that is offset by a massive growth of personal debt and rising living costs.
The data tracks the ongoing redistribution of wealth from the working class to the wealthy as a result of the pro-Wall Street policies of both the Republican and Democratic parties. It substantiates the oligarchic character of the United States.
Social inequality
The Gini index, used to measure social inequality, with higher figures indicating a wider economic divide, rose slightly from 2015 (.479) to 2016 (.481). The 2016 figure, according to rankings in the CIA World Factbook, makes the US slightly more equal than Madagascar and less equal than Mexico.
In terms of aggregate income share, the shift from 2015 to 2016 is as follows:
The growth in inequality is even starker when traced from 2007, the year before the Wall Street crisis.
The data reflects income and not wealth, thereby providing an incomplete and conservative indication of the scale of inequality. Even within the highest quintile, the income share increased only for the top 10 percent, and, in particular, the top 5 percent.
Household income
The corporate media has portrayed the report as a sign of positive income growth, since it shows a slight rise in median income of 3.2 percent from 2015 to 2016.
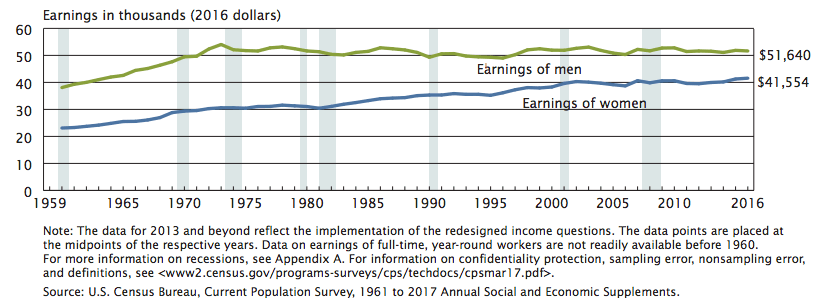
But according to the Census data, the earnings of “full-time, year-round workers” remained stagnant. For men in this category, a total of 63.9 million people, earnings declined by 0.4 percent, from $51,859 in 2015 to $51,640 in 2016. For women in this category, 47.2 million people, there was a minor increase, 0.7 percent, from $41,257 in 2015 to $41,554 in 2016. In other words, families with 2 adults working full-time saw a paltry $78 increase in their yearly earnings from 2015 to 2016.
Claims of rising incomes mask the growth of inequality. The Census data shows that the household income of the 90th percentile (the 100th being the highest) was 12.53 times higher than the household income of the 10th percentile in 2016, up from 12.23 times higher in 2015 and 11.18 times higher in 2007. The degree to which income is concentrated in the richest 10 percent of the population is exemplified by the fact that the 5th percentile boasted a household income 3.82 times higher than the 50th percentile in 2016, up from 3.79 times in 2015 and 3.52 in 2007.
As Bloomberg News reported Wednesday, “Since 2007, average inflation-adjusted income has climbed more than 10 percent for households in the highest fifth of the earnings distribution, and it’s fallen 3.2 percent for the bottom quintile. Incomes of the top 5 percent jumped 12.8 percent over the period.”
For the working class, any income increase was transferred to the corporate elite in the form of rising debt payments and increasing living expenses, especially for health care.
According to figures from eHealth, a large private health exchange, average deductibles for families rose 5 percent from 2016 to 2017 (a year after the period covered by the Census report) and average individual premiums rose 22 percent over the same period.
The rising cost of student debt alone largely erases income increases seen by some young people. According to the Census, those aged 15 to 24 saw an income increase of 13.9 percent, from $36,564 in 2015 to $41,655 in 2016, while incomes for young people aged 25 to 34 rose 4.9 percent, from $58,091 to $60,932, nearly double the percentage increase for older age groups.
However, in 2016, student debt rose to an average of $30,000 per young person, up 4 percent from 2015, eliminating over 80 percent of the income rise for 25-34 year olds. For 15 to 24 year olds, the $4,000 increase in median income would hardly cover one sixth of the average debt payment, let alone make up for the fact that young people face a future in which they are unlikely to receive a pension, Social Security or Medicare.
Rising debt levels are not a phenomenon limited to young people. A Bloomberg report from August 10 notes that credit card defaults increased from the beginning of 2015—when roughly 2.5 percent of debt holders defaulted—to the end of 2016, when the total hit 3 percent. This figure subsequently climbed in 2017 to reach 3.49 percent.
Bloomberg notes: “After deleveraging in the aftermath of the last US recession, Americans have once again taken on record debt loads that risk holding back the world’s largest economy... Household debt outstanding--everything from mortgages to credit cards to car loans--reached $12.7 trillion in the first quarter [2017], surpassing the previous peak in 2008 before the effect of the housing market collapse took its toll, Federal Reserve Bank of New York data show.”
“For most Americans,” the report continues, “whose median household income, adjusted for inflation, is lower than it was at its peak in 1999, borrowing has been the answer to maintaining their standard of living. The increase in debt helps explain why the economy’s main source of fuel is providing less of a boost than in the past. Personal spending growth has averaged 2.4 percent since the recession ended in 2009, less than the 3 percent of the previous expansion and 4.3 percent from 1982-90.”
The Bloomberg report explains that income from wages minus household debt trended downward in 2015, meaning that debt is rising faster than wages, causing a loss of roughly $500 billion across the US economy in the space of just one year.
Poverty rate
Though the Census report shows that the poverty rate declined from 13.5 percent of households in 2015 to 12.7 percent in 2016, this figure is substantially higher than the 11.3 percent level that prevailed in 2000. In reality, individuals and families must make 2.5 to 3 times the official poverty rate of $12,000 for an individual, $15,500 for a married couple and $25,000 for a family of four just to make ends meet.
What the data really shows is that the poorest half of the country--over 150 million people--is in a desperate financial position, with the next poorest 40 percent facing constant financial strain and a declining share of the national income. In regard to poverty, the Census Bureau maintains figures that go up only to 200 percent of the official poverty level. The latest report shows that 95 million people—29.8 percent of the population—fall into this category. The share of those under the age of 18 in this category is much higher--39.1 percent.
This is the context for the drive by the Trump administration and both big business parties to slash corporate taxes, impose a health care “reform” that will increase costs for millions of people, and accelerate the transfer of wealth from the working class to the financial aristocracy.
Census Bureau: Mens’ Wages Remain Below 1973 Levels
Americans’ median pay packets have been flat since 1973, even though the vastly expanded federal government has justified its own salaries and its many massive spending and policy programs as a sure-fire way to boost education, productivity, and wages.
The colossal 44-year failure of the federal government to help grow American men’s wages — or even to reduce poverty rates — is laid bare in the latest report from the Census Bureau, “Income and Poverty in the United States: 2016.”
The dense report includes myriad detailed tables of data around one shocking chart, which reveals no growth in men’s wages for the past 44 years, or since President Richard Nixon was beginning his second term in office.
Median earning of full-time, year-round workers, 15 years and older, 1960 to 2016.
The sudden flatline followed a 31 percent rise in all men’s median wages from 1960 to 1972.
During the 44-year period since 1973, income among women grew by roughly 30 percent as more skilled and trained women entered the market, gained experience, and were promoted to better-paying jobs. Those opportunities and contributions are good news — but they do not change the reality that men’s income has been flat for 44 years.
In fact, the report notes that “the real median earnings of full-time, year-round working men were 1.1 percent lower in 2016 than in 2007.”
There are many explanations for the flat income, such as the massive growth in the labor supply when 30 million additional American women and roughly 30 million immigrants joined in the marketplace competition for good jobs. For example, a pro-immigration panel at the prestigious National Academies of Science estimated in 2016 that the huge government-imposed inflow of immigrants since 1965 has imposed a hidden 5 percent “immigration tax” on Americans’ pay packets.
Technology has made many individuals workers more productive but also sidelined many others, such as newspaper printers and steelworkers. Peaceful international trade has allowed men to sell more products overseas but also allowed employers to hire foreign workers instead of Americans. Whatever the combinations of reasons, the mid-point for men’s income has been flat for 43 years, according to the Census Bureau.
The flat-earnings chart needs some explanation:
It shows only inflation-adjusted, pre-tax pay packets, so it excludes the impact of inflation, taxes and government benefits, such as food-stamps and tax-breaks for children, or of Obamacare’s subsidies and spending obligations.
It shows median income, which is the midpoint of the income scale. Half the people earn above the line, half the people earn below the line. Average income would be higher, but less revealing, because a higher share of income is going to the highest earners, compared to back in the 1970s.
The chart shows the income of year-round, full-time workers, excluding part-workers or seasonal workers, or those who work on-and-off under contracts. The chart does not make distinctions by race.
The chart shows individuals’ income, not the income of households, which has fluctuated as the average number of children or adults has declined.
The chart only shows income, but not the quality of goods in the stores, such as Starbucks coffee, cheap products imported from China, high-tech music players, improved autos or better health-care. That rise in product quality from competing companies — not claimed policy improvements from federal agencies — has provided the vast majority of material gains for Americans amid flat incomes.
The details are provided on Table A-4, on page 49 of this PDF.
The median earnings for all men employed year-round was $51,640 in 2016, which is still far below the $54,030 earned by full-time men in 1973. It is also below the $51,938 earned in the 2000 Internet boom, or the $52,222 earned in the 2007 property bubble when large-scale legal and illegal immigration provided employers with millions of alternative imported workers.
The post-1973 reality of flat income is a huge contrast to the rapid growth from 1960 up to the 1973 oil shock and the reopened inflow of immigrant labor after 1965. During the twelves years 1960 to 1972, the median average wages for all males — including minorities, seasonal workers, and contract workers — rose from by 31 percent, from $31,926 to $41,013.
When the income of all men is gauged, the Bureau concluded that all men’s median income in 1973 was $41,935. It dropped after 1973 and rose back up to $43,360 in 1999 as companies competed for the few unemployed workers during the first Internet boom. Income crashed in 2008 to a depression-low of $39,636 in 2012 once the federal government’s real-estate bubble burst. Since then, income has slowly climbed back to $42,220 in 2016 amid the continuous public protest against the federal government’s cheap-labor economic strategy, which is exemplified by the bipartisan 2013 “Gang of Eight” amnesty legislation.
Other data in the report shows that the nation’s poverty rates have barely budged since the 1960s, although many people in the United States are wealthier than many people n Europe. For example, the percentage of American said to be in poverty was 11.1 percent in 1973 and 12.7 percent in 2016.
That national poverty rate climbed, in part, because of the population of Latinos spiked from 10.8 million in 1973 to 57.6 million in 2016. Poverty among Latinos was 19 percent in 2016, little changed from 1973.
The report also noted that:
The official poverty rate decreased by 0.8 percentage points between 2015 and 2016. At 12.7 percent, the 2016 poverty rate is not statistically different from 2007 (12.5 percent), the year before the most recent recession.
In real terms, median earnings of full-time, year-round working women in 2016 were 2.3 percent higher than their 2007 median, the year before the most recent recession. The real median earnings of full-time, year-round working men were 1.1 percent lower in 2016 than in 2007.
In 2017, the number and percentage of shared households remained higher than in 2007, the year before the most recent recession. In 2007, 17.0 percent of all households were shared households, totaling 19.7 million households. In 2017, 19.4 percent of all households were shared households, totaling 24.6 million households.
The same period has seen a massive growth of social inequality, with income and wealth concentrated at the very top of American society to an extent not seen since the 1920s.
“This study follows reports released over the past several months documenting rising mortality rates among US workers due to drug addiction and suicide, high rates of infant mortality, an overall leveling off of life expectancy, and a growing gap between the life expectancy of the bottom rung of income earners compared to those at the top.”
The latest effort to give amnesty to more than a million illegal aliens and potentially cause a surge at the U.S.-Mexico border, as well as increased levels of legal immigration, is being backed by the billionaire GOP mega donors Charles and David Koch.
A new amnesty plan by Sen. James Lankford (R-OK) and Sen. Thom Tillis (R-NC) would legalize millions of illegal aliens currently in the U.S. who are shielded by the Obama-created Deferred Action for Childhood Arrivals (DACA) program and others who qualify for the amnesty.
Under Lankford and Tillis’ legislation, known as the Succeed Act, 3.3 million illegal aliens would be eligible for the amnesty, as Migration Policy Institute figures show, and eventually be able to obtain U.S. citizenship.
Current legal immigration law allows naturalized citizens to legally bring foreign family members to the U.S. as well, meaning an amnesty for 3.3 million illegal aliens could result in an overall chain migration upwards of 6 to 8 million foreign nationals.
The pro-mass immigration, pro-free trade Koch brothers are now supporting the widespread amnesty plan through their Hispanic-oriented organization known as the Libre Initiative.
“A number of conservative lawmakers in the House and Senate have introduced legislative proposals to address this challenge,” Libre Initiative President Daniel Garza said in a statement. “We are grateful for their leadership on this important issue. We believe that this proposal should be considered among those worthwhile reforms that have been set forward, and that Congress should seize the opportunity to debate and adopt a solution to the unilateral executive action imposed by President Obama, without regard to Congress.”
Also supporting the amnesty deal is the U.S. Chamber of Commerce, which has been vocal about their disdain for President Trump’s pro-American worker reform efforts, instead favoring guest worker programs that import hundreds of thousands of cheap, foreign laborers to take U.S. jobs.
In a statement about the amnesty legislation, the Chamber of Commerce officials said they were “encouraged” by the potentially pathway to citizenship for 3.3 million illegal aliens.
The Koch brothers most recently, as Breitbart News reported, said through their Libre Initiative that they were “encouraged” by news that Trump may cave on his campaign promise to oppose amnesty for illegal aliens.
During the 2016 presidential election, Trump made clear his opposition to taking money from the business-aligned Koch brothers, saying he did not need their money to win the election and blasting Koch-funded opponents as “puppets” for the billionaire duo.
Despite their strong opposition to Trump’s “America First” agenda, the Koch brothers have an ally in White House discussions and potential policy initiatives in the form of Marc Short, who now serves as Trump’s Legislative Affairs Director.
Prior to joining the Trump White House, Short led the “Never Trump” movement inside the Koch brothers’ pro-immigration organizations, as Breitbart News reported.
In May 2016, during the height of the Republican presidential primary, where Trump was taking the country by storm on his populist and economic nationalist agenda, Short was heading an effort to derail the then-front-runner.
At the time, National Review exclusively reported that Short was leading an effort inside the Koch brothers’ organizations to take down Trump and his agenda, partly by supporting Sen. Marco Rubio (R-FL), who infamously helped author the ‘Gang of Eight’ amnesty bill.
John Binder is a reporter for Breitbart News. Follow him on Twitter at @JxhnBinder
A Federation for American Immigration Reform report reveals that illegal aliens are costing the US taxpayer $135 billion. That cost includes medical care, education, and law enforcement expenses.
Washington Examiner:
The swelling population of illegal immigrants and their kids is costing American taxpayers $135 billion a year, the highest ever, driven by free medical care, education and a huge law enforcement bill, according to the the most authoritative report on the issue yet.
And despite claims from pro-illegal immigration advocates that the aliens pay significant off-setting taxes back to federal, state and local treasuries, the Federation for American Immigration Reform report tallied just $19 billion, making the final hit to taxpayers about $116 billion.
State and local governments are getting ravaged by the costs, at over $88 billion. The federal government, by comparison, is getting off easy at $45 billion in costs for illegals.
President Trump, Attorney General Jeff Sessions and conservatives in Congress are moving aggressively to deal with illegals, especially those with long criminal records. But their effort is being fought by courts and some 300 so-called "sanctuary communities" that refuse to work with federal law enforcement.
The report, titled "The Fiscal Burden Of Illegal Immigration on U.S. Taxpayers," is the most comprehensive cost tally from FAIR. It said that the costs have jumped about $3 billion in four years and will continue to surge unless illegal immigration is stopped.
The cost of allowing illegals into the country is only going to get larger as states and cities with sanctuary policies dole out more and more benefits to those here illegally.
The $135 billion price tag far exceeds what the US government spends on transportation and nearly equals the entire Department of Education budget. Perhaps if we reminded the American people when they are travelling down poorly maintained roads and wondering why school funding is getting short changed, that a primary cause is the cost of allowing people who have no business being in the country recieving benefits that used to be reserved for US citizens.
CALL IT OBAMA-CLINTONOMICS OR TRUMPERNOMICS FOR THE SUPER RICH!
More than 52 million Americans live in economically distressed communities
By Sandy English 28 September 2017
A new analysis of Census data shows that the so-called economic recovery under the Obama administration was an unmitigated catastrophe for the 20 percent of the American population that live in the poorest areas of the United States and that gains of jobs and income have gone overwhelming to the top 20 percent richest areas.
“The 2017 Distressed Communities Report,” published by the Economic Innovation Group (EIG), analyzes the census data for 2011-2015 for people living in each of the nearly 7,500 American zip codes according to several criteria.
The EIG’s Distressed Communities Index (DCI) considers the percentage of the population without a high school diploma, the percentage of housing vacancies, the percentage of adults working, the percentage of the population in poverty, the median income ratio (the percentage of median income that a zip code has for its state), the change in employment from 2011 to 2015, and the change in the number of businesses in the same period.
The report divides the findings for zip codes into five quintiles based on these indicators, rated from worst- to best-performing: distressed, at risk, mid-tier, comfortable, and prosperous.
The results show that distressed communities—52.3 million people or 17 percent of the American population—experienced an average 6 percent drop in the number of adults working and a 6.3 percent average drop in the number of business establishments.
“Far from achieving even anemic growth from 2011 to 2015,” the report notes, “distressed communities instead experienced what amounts to a deep ongoing recession.”
Further, “fully one third of the approximately 44 million Americans receiving SNAP (Supplemental Nutrition Assistance Program or food stamps) and other cash public assistance benefits (such as Temporary Assistance for Needy Families (TANF)) live in distressed communities.” The report notes that most distressed communities have seen zero net job growth since 2000.
Residents in these zip codes are five times more likely to die than those in prosperous zip codes. Deaths from cancer, pregnancy complications, suicide, and violence are even higher. “Mental and substance abuse disorders are 64 percent higher in distressed counties than prosperous ones, with major clusters in Appalachia and Native American communities where rates exceed four or five times the national average,” the report continues.
One other important and alarming fact which the report highlights is that over a third of the distressed zip codes contain so-called “brownfield” sites—areas which are polluted or contaminated in some way. Not only do these have impacts on real estate and business development, they present a whole array of health hazards to the very poorest Americans.
Distressed communities can be found all over the United States but are concentrated in the South: 43 percent of Mississippi’s zip codes are distressed, followed by Alabama, West Virginia, Arkansas and Louisiana. According to the report, [the South] “is home to a staggering 52 percent of all Americans living in distressed zip codes—far above its 37.5 percent share of the country’s total population.”
After this, the Southwest and Great Lakes region have the largest share. In the Northeast, most distressed communities tend to be found in urban areas and in the South, primarily in rural areas.
The biggest cities with the largest numbers of distressed zip codes are Cleveland, Ohio, Newark, New Jersey, Buffalo, New York, Detroit, Michigan and Toledo, Ohio. Mid-sized cities with the highest number of distressed zip codes include Youngstown, Ohio, Trenton, New Jersey, Camden, New Jersey, Gary, Indiana, Hartford, Connecticut and Flint, Michigan.
Urban counties with the highest number of distressed zip codes include Cook County in Illinois, with Chicago at its center, Los Angeles County in California, Harris County in Texas, with Houston at its center, and Wayne County in Michigan, encompassing Detroit. Most of these urban areas were once industrial centers and home to the industrial working class.
Distressed zip codes that have a majority of minorities living in them are more than twice as likely to be distressed as zip codes that are majority white. “In total,” the report notes, “45 percent of the country’s majority-minority zip codes are distressed and only 7 percent of them are prosperous.” At the same time there are numerous distressed communities that are almost completely white. A quarter of the total distressed population is under 18.
The report found that the economic benefits of the recovery after the 2008 recessions have gone to the top quintile of zip codes, where the wealthier layers of the population live, including not only the very rich but also the upper middle class.
These areas, which the DCI terms prosperous, and make up roughly 85 million Americans or 27 percent of the US population, have for the most part the economic wherewithal to finance higher levels of education, have the lowest housing vacancy, highest percentage of working adults, and have had the lion’s share of job and business expansion.
“The job growth rate in the top quintile was 2.6 times higher than nationally from 2011 to 2015, and business establishments proliferated three times faster than they did at the national level,” the report notes. “Prosperous zip codes stand worlds apart from their distressed counterparts, seemingly insulated from many of the challenges with which other communities must grapple. The poverty rate is more than 20 points lower in the average prosperous community than it is in the average distressed one.”
The report makes much less of an analysis of the other three, middle quintiles, the at risk, mid-tier, and comfortable categories, but it does note some trends that address the overall trends nation-wide. “A remarkably small proportion of places fuel national increases in jobs and businesses in today’s economy. High growth in these local economic powerhouses buoys national numbers while obscuring stagnant or declining economic activity in other parts of the country.”
One of the more telling aspects of the report is that extreme poverty in the US is presided over by both capitalist parties: Democratic and Republic politicians have equal numbers of distressed communities in their constituencies. Democrats, in fact, “represent six of the 10 most distressed congressional districts.”
Another observation from the voting data, and one of the few that looks at conditions beyond the bottom and top quintiles, is worth quoting in full:
“President Trump accumulated a 3.5 million vote lead in counties that fell into the bottom three quintiles of well-being (equivalent to 9.4 percent of all votes cast in these counties). A vast array of factors determined voting patterns in the 2016 election, but it stands that the ‘continuity’ candidate performed better in the places benefiting most from the status quo, while the ‘change’ candidate performed better in the places one would expect to find more dissatisfaction.”
Broader figures and the historical view of wealth distribution in the US—that one percent of the population control 40 percent of the wealth or the decades-long decline in the percentage of the national income that goes to the working class—is not brought out in the report but the data add to a complete picture of social conditions across the United States, the character and geographical distribution of social and economic conditions in a country of more than 320 million.
The portrait provided by the EIG report is not simply one of increasing misery and poverty for the bottom 20 percent, and not only one in which only a minority of Americans are achieving anything like “prosperity,” but of growing and explosive dissent among tens of millions.
It exposes as a bold-faced lie the claim that President Obama made at the end of his second term, that “things have never been better” in America.
The conversation surrounding illegal immigration is deeply personal for many people -- it is emotionally-charged and politically divisive. Debates often devolve into mud-slinging contests, and arguments morph into feigned outrage, even violent protests. But from an economic perspective the question is settled science: illegal aliens cost taxpayers billions, impoverish American workers, and are completely unnecessary for America’s economic success.
To begin with, illegal immigrants are expensive. According to the Federation for American Immigration Reform’s 2017 report, illegal immigrants, and their children, cost American taxpayers a net $116 billion annually -- roughly $7,000 per alien annually. While high, this number is not an outlier: a recent study by theHeritage Foundation found that low-skilled immigrants (including those here illegally) cost Americans trillions over the course of their lifetimes, and a study from the National Economics Editorial found that illegal immigration costs America over $140 billion annually. As it stands, illegal immigrants are a massive burden on American taxpayers.
Although border control is a federal responsibility, state and local governments shoulder two-thirds of the costs associated with illegal immigration. Unsurprisingly, this costs California more than any other state: California spends$30.3 billion on illegal aliens annually -- 17.7 percent of the state budget. Texas is next: illegal immigration costs the State of Texas $12.4 billion annually, or roughly 10 percent of the state's budget. In third place is New York, which spends $7.4 billion on illegal immigration.
Of course, the tax burden is only part of the story: illegal immigration also distorts the labor market, hurting American workers. Ever hear of the law of supply and demand? It is how the free market determines prices: when demand increases, prices increase (more people bid-up the price); conversely, when supply increases, prices decrease (less scarcity means less urgency), and vice versa. Supply and demand underpins the price of everything from gasoline, to apples, to the value of a person’s labor -- surgeons command high prices because there is a limited supply of surgeons, whereas store clerks make minimum wage because anyone can be a store clerk.
According to Pew Research, illegal immigration has flooded America’s labor market with at least 12 million new workers. This has dramatically, and rapidly increased the labor supply and therefore decreased wages for American workers. Ample evidence supports this claim. For example, before Hurricane Harvey, President Trump’s crackdown on illegal aliens had already caused wages for construction workers to rise by 30 percent in Texas (half of Texas’ construction workers were illegal aliens). Likewise,businesses in Maine were forced to hire American workers after the availability of visas for temporary foreign workers were restricted. As a result, unemployment decreased, wages increased, and working conditions improved in order to attract American workers. Illegal labor has distorted America’s labor markets, and hurt American workers in the process.
Finally, America’s economy will not collapse without easy access to illegal labor.
The standard refrain can be summed up as: “we need illegals to do the jobs Americans won’t do.” This is nonsense for two reasons. First, the claim is predicated upon the false assumption that America’s labor market is saturated and requires more workers to continue growing. This could not be further from the truth: right now fewer that 150 million Americans (out of 320 million) are employed, likewise there are 23 million Americans currently looking for work -- twice the number of illegal aliens in the country. Even assuming that every illegal aliens was employed, replacing them with American workers would still leave 11 million Americans unemployed.
Second, the claim is undermined by actual labor statistics. According to theBureau of Labor Statistics, millions of Americans -- of all races -- currently work as janitors, laborers, and agricultural workers. In fact, only four percent of American agricultural workers are illegal aliens, according to a report in theNational Review, putting to bed the myth that we would starve without illegal laborers. Clearly Americans are willing to work any job, provided they are compensated at fair market value -- this is not currently happening precisely because many illegals work under-the-table.
Believe it or not, states without illegal immigrants, like Montana or Ohio, are not economic backwaters with exorbitantly high costs of living -- people in Idaho can still afford McDonald’s and Starbucks, they just pay teenagers to work the drive-thrus. In fact, the cost of living in said states is often cheaper, because their governments do not require high taxes to subsidize legions of illegal aliens.
It is also worth mentioning that America is the only developed nation, until very recently, that imports millions of illegal immigrants to work in its service sector -- other rich nations like Japan and Canada, do not. Yet despite this, the GDP per capita of Japan has actually grown faster than America’s during the same period. The same is true of Canada and Australia. If illegal immigration is such an economic bonanza, why are Americans being left behind by nations without this “advantage”?
University professors, Silicon Valley CEOs, and politicians are not losing their jobs to illegals -- ordinary folk are. Illegal immigration is a contentious issue, but it remains important to couch policy discussions in facts -- not just abstract principles.


 According to Pew Research, illegal immigration has flooded America’s labor market with at least 12 million new workers. This has dramatically, and rapidly increased the labor supply and therefore decreased wages for American workers. Ample evidence supports this claim. For example, before Hurricane Harvey, President Trump’s crackdown on illegal aliens had already caused wages for construction workers to rise by 30 percent in Texas (half of Texas’ construction workers were illegal aliens). Likewise,businesses in Maine were forced to hire American workers after the availability of visas for temporary foreign workers were restricted. As a result, unemployment decreased, wages increased, and working conditions improved in order to attract American workers. Illegal labor has distorted America’s labor markets, and hurt American workers in the process.


 Inside the house, forensic investigators with the Tamaulipas Attorney General’s Office discovered various corpses and body parts in stages of incineration and decomposition. Some of the human remains were only superficially incinerated, while others were mostly turned into charred ashes.
 The discovery comes as two rival factions of the Gulf Cartel continue fighting for control of this city. Since early May, the factions carried out hundreds of kidnappings, drive-by attacks, and more than 190 confirmed murders; however, the real numbers could actually be much higher.
 One of the strategies used by both factions of the Gulf Cartel involves the kidnapping of lookouts, foot soldiers, and street-level dealers. As Breitbart Texas has reported, these victims are often tortured and murdered with their bodies either being dumped in shallow, clandestine grave sites or are incinerated.
Known as “cocinar” or “guiso”, the practice involves the use of 55-gallon drums that are filled with wood, old tires, and fuel to keep the flames burning while cartel members throw human remains into the fire. As Breitbart Texas reported, the practice is used by the Gulf Cartel in the rural areas around Reynosa. The most recent discovery appears to be unique in nature since it is the first time that a “cocina” was discovered inside the city.
One of the strategies used by both factions of the Gulf Cartel involves the kidnapping of lookouts, foot soldiers, and street-level dealers. As Breitbart Texas has reported, these victims are often tortured and murdered with their bodies either being dumped in shallow, clandestine grave sites or are incinerated.
Known as “cocinar” or “guiso”, the practice involves the use of 55-gallon drums that are filled with wood, old tires, and fuel to keep the flames burning while cartel members throw human remains into the fire. As Breitbart Texas reported, the practice is used by the Gulf Cartel in the rural areas around Reynosa. The most recent discovery appears to be unique in nature since it is the first time that a “cocina” was discovered inside the city.
 Editor’s Note: Breitbart Texas traveled to the Mexican States of Tamaulipas, Coahuila, and Nuevo León to recruit citizen journalists willing to risk their lives and expose the cartels silencing their communities. The writers would face certain death at the hands of the various cartels that operate in those areas including the Gulf Cartel and Los Zetas if a pseudonym were not used. Breitbart Texas’ Cartel Chronicles are published in both English and in their original Spanish. This article was written by “A.C. Del Angel” from Tamaulipas.


 Federal, State and local government spending currently amounts to $7 Trillion per year or 37% of the nation’s Gross Domestic Product (GDP). By 2048 these entities combined will be spending in excess of $17 Trillion per year, or over 50% of GDP. As interest costs on the overall debt will increase from $0.4 Trillion to $2.4 Trillion, healthcare spending (includes Obamacare subsidies) will vault from $1.6 Trillion to $3.7 Trillion, Social Security and pension payments will grow from $1.4 Trillion to $3.5 Trillion, education spending from $1 Trillion to $2.4 Trillion, and welfare programs from $0.5 Trillion to $1.3 Trillion.