Minneapolis police officer sentenced to over 12 years in prison for murder of Justine Damond
Last Friday, former Minneapolis, Minnesota police officer Mohamed Noor was sentenced to 12.5 years in prison for the murder of 40-year-old Australian-American Justine Damond after a rare guilty verdict in a case where a police officer killed a civilian. Shortly after Noor was found guilty, Damond’s family won a settlement with the city of Minneapolis for $20 million.
A month-long trial in April resulted in Noor being found guilty of third-degree murder and involuntary manslaughter and not guilty of second-degree murder. The outcome of Noor’s trial was the first time a police officer was convicted for killing a civilian on-duty in Minnesota and his trial was only the second time a police officer was tried for killing a person on duty in the state’s history.
Noor fatally shot Damond on the night of July 15, 2017 while responding to a 911 call about a possible sexual assault. Noor and his partner at the time, Matthew Harrity, drove through the alley with both their squad car lights and body cameras turned off. Both officers say they heard a loud noise, which prompted them to draw their weapons. Sitting in the passenger seat, Noor quickly opened fired at Damond who was approaching the driver side of the vehicle, hitting her and killing her.
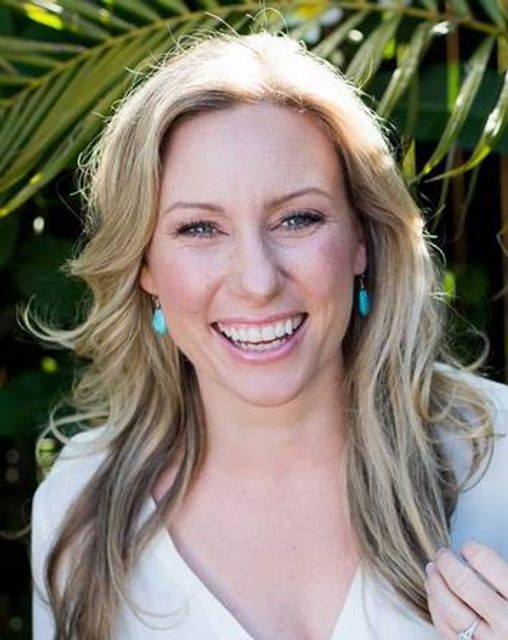 Justine Damond
Following the murder, Minneapolis police dragged their feet on cooperating with an investigation by the Minnesota Bureau of Criminal Apprehension (BCA) and remained almost completely silent until a year after the incident when Hennepin County Attorney Mike Freeman announced charges against Noor.
Noor’s trial sparked a storm of criticism from sections of liberal commentators and prominent proponents of identity politics claiming that charges had only been brought since Noor, a black Somali-American immigrant, had shot and killed a white Australian woman.
Mel Reeves, a local activist who publishes Fight the Power Journal (FTPJ), told the Star Tribune, “the system has an easier time convicting a black man in a blue uniform,” while adding that he agreed with the verdict. However, in an article on FTPJ following Noor’s conviction last month, Reeves attempted to paint the verdict as the result of racism in the court system. He asked, “If race is not a factor (as Freeman claims) then how does one explain the failure of the judicial system in practically every locale in the US to charge White cops (or Black cops) for killing Black people?” He then follows up by claiming “Race is ALWAYS a factor in a racist society!”
Nekima Levy Armstrong, a leading figure in the Minneapolis Black Lives Matter and president of Minneapolis NAACP wrote in a Facebook post, “This is unprecedented, just like every other aspect of this case, and I would posit once again that the only reason this is happening is because the officer in question was Black, Muslim, and a Somali immigrant, and the victim was an affluent white woman.”
The comments from Reeves and Levy Armstrong ignore and cover up recent guilty verdicts and sentencing of other white officers who killed black victims in an attempt frame the trial, conviction and sentencing of killer cops as the result of racism. With this outlook, what would be the explanation of the conviction of Jason Van Dyke, the white officer who murdered Laquan McDonald in Chicago, sentenced to nearly 7 years, and Michael Slager, the white cop in South Carolina who received 20 years in prison after murdering Walter Scott?
The elevation of race as the main issue with police violence in America leaves out the fact that police officers are rarely ever charged for killing civilians regardless of the skin color of the officer or victim.
What the cases of Noor, Van Dyke and Slager share is that the circumstances around the shooting prevented the police from justifying their actions and acquitting the officers. In each case, the officers used the same tried and true defense argument, that they feared for their life, but overwhelming evidence refuted these claims entirely.
Far from being an “an isolated case with an isolated result based on racial dynamics and affluence of the victim, not to mention the race of the officer” as Levy Armstrong claimed following Noor’s trial, the events following Damond’s killing followed a common template—the police searched her home, looking for a justification for her murder, while the department refused to cooperate with investigators, working to prevent the release of any information that would further incriminate Noor.
Noor’s case is rare because police in the United States are rarely ever charged or convicted in cases where they have killed a civilian. In 12,000 cases of police killings from 2005 to 2017, only 80 were charged, and 30 were found guilty.
Moreover, what Reeves and Levy Armstrong fail to address is the social function of the police in capitalist society. While racism is encouraged by the ruling class, and racism does play a role in police killings, police function mainly as an occupying military force, treating the working class as a hostile force regardless of ethnicity or national origin. Because of this, the police are encouraged to kill with almost complete legal impunity. The fact is that the main target of police violence is the working class and poor, from whom the ruling class is fearful of any organized opposition to historic levels of social inequality and constant attacks on democratic rights.
Behind the epidemic of police killings in America: Class, poverty and race
Part one
By Benjamin Mateus
20 December 2018
Introduction
The steady rise in police killings in the United States is the manifestation of an ongoing civil war between the ruling elite, the top one-tenth of one percent, and the working class. It is not “white cops vs. black youth,” as portrayed by the media and groups like Black Lives Matter and the pseudo-left, anxious to elevate race over class. It is the armed representatives of the capitalist state (frequently black and Hispanic, as well as white) against the most impoverished sections of the working class, white, black, Hispanic and Native American.
This study reviews all the data available on police shootings for the year 2017, and analyzes it based on geography, income, and poverty levels, as well as race. It identifies a major omission in all the published accounts: the vast and rising death toll among working-class white men in rural and small-town America, who are being killed by police at rates that approach those of black men in urban areas.
Police violence is focused overwhelmingly on men lowest on the socio-economic ladder: in rural areas outside the South, predominately white men; in the Southwest, disproportionately Hispanic men; in mid-size and major cities, disproportionately black men. Significantly, in the rural South, where the population is racially mixed, white men and black men are killed by police at nearly identical rates. What unites these victims of police violence is not their race, but their class status (as well as, of course, their gender).
The wave of killings by police officers that occurred in the period from 2014 to 2016, many caught on personal smartphones and released through social media channels, led to an outpouring of popular rage against these crimes. Protests against these horrific killings perpetrated by the police officers, who for the most part face little or no consequences, have become commonplace. Some of the best-known cases include:
- Eric Garner, July 17, 2014, Staten Island, NY (Grand jury did not indict Officer Pantaleo.)
- Michael Brown, age 18, August 9, 2014, Ferguson, MO (Grand jury did not indict Officer Wilson.)
- Laquan McDonald, October 20, 2014, Chicago, IL (Officer Van Dyke convicted of second-degree murder. On December 14, 2018, Van Dyke was denied a new trial, with sentencing set for January 18, 2019.)
- Tamir Rice, age 12, November 23, 2014, Cleveland, OH (Wrongful death suit settled. No charges brought against the officers.)
- Walter Scott, April 4, 2015, North Charleston, SC (Because of a bystander’s video, Officer Slager was convicted of second-degree murder and sentenced to 20 years.)
- Freddie Gray, April 12, 2015, Baltimore, MD (He died of spinal cord injuries during a “rough ride” in the back of a police van. Six officers were indicted but two were acquitted, a third ended in a hung jury, after which charges were dropped against the others.)
- Sandra Bland, July 10, 2015, Prairie View, TX (Found dead in her cell and ruled a suicide. The arresting officer was fired and indicted for perjury. No one charged with her death.)
- Alton Sterling, July 5, 2016, Baton Rouge, LA (District attorney decided not to bring charges against two policemen.)
- Philando Castile, July 6, 2016, Falcon Heights, MN (Officer Yanez acquitted of all charges a year later, then fired.)
All of these victims were black and poor. All the killings took place in urban areas or their suburbs. In all but the Castile case, the officers involved were white. These demographic characteristics were well publicized and became the media template for all such police killings. But a more thorough investigation shows that the killing of poor blacks by white cops is only one aspect of the reign of terror by American police against the working class, and not even the most common form of such killings.
Enormous resources have been mobilized to spread the “race, not class” mythology of police killings. Black Lives Matter (BLM) was formed in the aftermath of Trayvon Martin’s killing by neighborhood watchman George Zimmerman in 2012. As a response to the growing tension within these communities associated with these killings, BLM was used to channel the anger along racialist lines and, ultimately and politically, in support of the Democratic Party.
As we wrote in 2017, “From the beginning, the ‘mothers of the movement’ Alicia Garza, Patrisse Cullors and Opal Tometi—who collectively adopted the famous hashtag—specifically opposed uniting blacks, whites and immigrants against the brutal class-war policies of the capitalist state. Instead, the group did its best to confine anti-police violence protests within the framework of the capitalist system and push a racialist and pro-capitalist agenda.”
Big money donors lined up behind BLM. The Ford Foundation made a six-year $100 million investment in the organization. BLM garnered endorsements from companies such as Facebook, Nike and Spotify. BLM has gone on to partner with Fortune 500 New York ad agency J. Walter Thompson (JWT) to create “the biggest and most easily accessible black business database in the country.”
The data on police killings
Before 2015, two federal databases, from the FBI and Bureau of Justice Statistics (BJS), were the main sources used to track police shootings. However, these figures, self-reported by the police, have been found to be incomplete and inaccurate. Accordingly, several private groups and media outlets began to systematically track police killings through news reports, publishing the data on their websites.
The Washington Post tracks people “shot dead” by police, while the Guardianrecords “all people killed by police, regardless of the means” and Fatal Encounters attempts to count all police killings as far back as the year 2000. Fatal Encounters, besides using news sources, also uses several other public databases and research methods. In 2015, the Washington Post counted 990 shot dead while the Guardian counted 1,146 killed. Fatal Encounters counted 1,357 killed.
Academicians and researchers, to provide a veneer of scientific corroboration to the racialist perspective promulgated by mainstream media, have been using the information in these databases to publish peer-reviewed articles to substantiate their perspective on identity politics, push through racialist agendas, and direct the national discussion on these issues. However, there is little substance to their analytical approach, which generally avoids the socio-economic dimension to the phenomenon of police killings, or at best, treats it as one more (usually lesser) factor, in the name of “intersectionality,” in which class is blended in to the basic framework of identity politics.
By example, a recently published paper in the American Journal of Public Health titled, “Risk of Police-Involved Death by Race/Ethnicity and Place, United States, 2012–2018,” toes the line that “race plays a powerful role in explanations of police-involved killings in the United States.” Their results note that in the US police kill on average 2.8 people per day. Blacks are killed at 1.9 to 2.4 deaths per 100,000 per year, a threefold higher rate than whites, who are killed by police at a rate of 0.6 to 0.7 per 100,000. Beyond these rudimentary statistics there is little else to take from the study than to accept the authors’ conclusions unquestioningly, “Indeed, our results show that—like other police-related outcomes, which vary across the nation according to local political and social forces—police-involved deaths are contingent upon local contextual environments. Structural racism, racialized criminal-legal systems, anti-immigrant mobilizations, and racial politics all likely play a role in explaining where police killings are most frequent and who is most likely to be a victim.”
The method of this study
The present study was undertaken to better understand the demographics and economic aspects of police killings in the US, treating police killings as though we were observing an epidemic and seeking to understand the main risk factors that made sections of the population more or less vulnerable. We used the 2017 data from the Washington Post database for our analysis. These were cross-referenced with the KilledbyPolice.net website to ensure accuracy and attempt to fill in missing information such as race, name, and age of some of the victims.
News reports from approximately 15 to 20 percent of these events were reviewed to glean the context of some of these killings as well as help locate the site of shooting for further in-depth analysis. We used information on the location of the shooting to perform a ZIP Code analysis for some of the metropolitan centers and medium-sized cities where blacks were killed at a much higher proportion than in the population. The US Census Bureau website was used to obtain demographic and economic data on states, cities and towns where police killings took place. Data USA and City-Data.com websites were used for population centers under 5,000 people. Economic data used included Median Household Incomes (MHI), Percentage in Poverty (PP), and employment and “not in the workforce” categories to determine the role of these factors in police killings.
Academic studies and news reports use national demographics to compare the rate of those killed by their race. For instance, blacks make up approximately 12 percent of the US population, but they make up about 25 percent of those killed by police. Therefore, blacks are killed by police at more than twice their representation. These numbers are standardized to a rate of numbers killed per 100,000 to form a consistent unit to compare across racial groups.
It should be understood that we had to use the category of “race” despite its completely unscientific character, because virtually all data on police killings describes the victims in such terms. More than three percent of the adult US population, and ten percent of all children, are officially categorized as “mixed race,” and from a historical standpoint, the proportion of Americans whose ancestry combines white, black and Native American is even larger. But victims of police killings, and their killers, are not usually categorized in media or government reports in that fashion.
Our statistics also used this methodology to conform to the published literature. However, our hypothesis differs from the published studies. The United States is not homogenously diverse. There are significant variations from state to state and from population centers like metropolises to small rural communities in how the demographics are configured. The Southeast states have large black populations in both urban and rural areas, the Midwest is predominately white, particularly outside city centers, and the Southwest has a very high Hispanic population. Metropolitan centers have higher minority populations while rural communities have a preponderance of white people. There are also considerable socioeconomic variations within these regions.
We tabulated the population estimates and demographics based on the locations where police killings took place which allowed us to compare these regions against the nation as a whole. This also provided the ability to compare economic data for these regions and provide a more accurate estimate of the real picture.
We used the Excel spreadsheet for performing and tabulating the basic statistics. The entire Washington Post data set was imported for this analysis. Web-based chi-squared tests were performed using analytic software to estimate confidence intervals and determine the significance of the findings, a statistical method used to denote a difference that has a low probability of being a chance occurrence. The P-value of 0.05 or less connotes that there is less than a 5 percent probability that the significance in the finding was due to chance. A P-value closer to 1.00 suggests that differences are random or minor. We also employed statistics that looked at observed vs. expected outcomes in each state. The observed outcomes are the reported racial distribution of killings in each state. The expected numbers are derived from the states’ actual demographics.
For example, in the state of Alabama, there were 25 people killed. Fourteen (56 percent) were identified as white, seven (28 percent) were black, and 1 (4 percent) was Hispanic. The actual state demographics are 65.8 percent white, 26.8 percent black and 4.2 percent Hispanic. The observed vs. expected outcomes P-value was 0.892 for blacks, meaning that the racial difference was not significant. This has enormous political importance: in Alabama, a state which historically is a byword for racially motivated police violence, there was no “preference” by the police for blacks as targets over whites. Similar “neutrality” by the police was found in Mississippi, an equally backward state from the standpoint of its history of racism. The racial explanation of police violence falls apart in precisely the locations where it should be most blatant.
To be continued
By Benjamin Mateus
By Benjamin Mateus
Behind the epidemic of police killings in America: Class, poverty and race
Part two
By Benjamin Mateus
21 December 2018
Income and poverty
According to the US Census Bureau, 328 million people reside in the United States. Non-Hispanic whites make up 60.7 percent, black or African American 13.4 percent, and Hispanics or Latino 18.1 percent of the population. The annual median household income (MHI) in 2016 dollars amounts to $55,322 and the percentage of the population living in poverty stands at 12.3 percent. There is wide variation in these figures from state to state. Table 2 below highlights these facts. The table also demonstrates a broadly uniform phenomenon: the areas in which police killings occurred—either the cities and towns, or in the case of rural districts, the counties—almost always have lower median household incomes and more people living in poverty than the statewide average.
In 2017, according to the Washington Post, 987 people were shot and killed by the police. Overwhelmingly, men constituted 95.2 percent of those killed. Racial demographics included 475 white non-Hispanic victims (48.2 percent), 231 black victims (23.4 percent) and 209 Hispanic victims (21.2 percent). Twenty-five Native Americans made up 2.5 percent of those killed though they constitute only 1.3 percent of the population. On the other hand, 19 Asians represented 1.9 percent of those killed though they constitute 5.8 percent of the US population.
Twenty-six people (after the data was cross-referenced with KilledbyPolice.net and news sources) had an unknown race assigned. They made up 2.6 percent of those killed by police.
When this data is standardized to the number killed per 100,000, whites were killed at 0.237 per 100k, blacks at 0.530 per 100k and Hispanics at 0.358 per 100k. The ratio of black death rate to white death rate stands at 2.24 and the ratio of Hispanic death rate to whites death rate at 1.51. This data is consistent with the published literature and often quoted to support the racialist perspective.
The police killing zone: USA−
However, when we calculated the demographics only for the regions in which a police killing occurred, there was a significant shift in both the demographics and socioeconomic status of this new population. We used the suffix minus (−) to denote the narrower region where a killing occurred. Illinois− would mean only those cities and rural counties in Illinois where police killed civilians. USA− includes only the cities and rural counties throughout the country in which a police killing occurred.
The region designated USA− accounts for 91,526,100 people. In other words, slightly more than one-quarter of the US population lives in a city or county where a police killing took place, and conversely, just under three-quarters live in cities or counties that were free of such killings.
The population of USA− has significantly different demographics from the USA as a whole. Non-Hispanic whites made up 44.5 percent, blacks 18.6 percent and Hispanics 26.7 percent of this region. The median household income is slightly lower at $52,218 per annum, and the percentage in poverty (PP) is much higher, at 19.5 percent.
If one compares the poverty rate of USA− to the poverty rate of the remaining nearly three-quarters of the country, where no police killings took place, the disparity is even more stark. The poverty rate is 19.5 percent in what might be called the police killing zone. It is only 9.5 percent, less than half that rate, in the rest of the country.
While poverty becomes a much more salient factor when considering just USA−, the opposite is true for race. In USA−, non-Hispanic whites experienced 1.169 deaths per 100,000, blacks 1.357 per 100,000 and Hispanics 0.856 per 100,000. The ratio of the black death rate to the white death rate was cut nearly in half, to 1.16, and the Hispanic to white ratio declined by more than half, to 0.73. Though blacks continued to be killed at a higher rate than whites, the differences between them became less profound. Comparing observed to expected, based upon the population living in USA−, 38 more whites (8.6 percent) were killed than expected, 47 more blacks (25.6 percent) were killed than expected but 67 fewer Hispanics (25.5 percent) were killed than expected.
When looking at economic data by race, in USA−, regions where white non-Hispanics were killed, the mean household income was $46,720 and 17.6 percent of the population was living in poverty, for blacks the figures were $47,010 and 20.3 percent, and for Hispanics, $50,070 and 19.1 percent.
Urban and rural differences
Only eighty-two black individuals (35.5 percent of all blacks killed by police) died in rural areas with populations of less than 100,000, excluding suburbs. These represented 8.3 percent of all people killed by police in 2017. The median household income in these regions is $41,661, and the proportion living in poverty stands at 20.9 percent.
Forty-five percent of all blacks killed by police were killed in large urban areas with populations of more than 300,000 (including the suburbs) while 20 percent were killed in smaller urban centers between 100,000 and 300,000, for a combined total of 65 percent of all blacks being killed in urban centers. The median household income and proportion in poverty in the urban centers where blacks were killed were $48,088 and 20.8 percent, respectively. Only seventeen black people were killed in suburbs (7.4 percent of all blacks and 1.7 percent of all people killed by police) where the median household income and proportion in poverty stand at $67,178 and 10.5 percent, respectively.
In contrast, out of 478 whites killed by police, 292 (61.7 percent of all whites killed and 29.6 percent of the people killed by police) were killed in rural areas with less than 100,000 population. The median household income and proportion living in poverty were $42,213 and 18.0 percent, respectively.
This figure is worth pondering. The number of whites killed by police in rural areas, 292, is just about exactly twice the number of blacks killed by police in urban areas, 149. But these white victims of police violence are almost invisible when it comes to reporting in the corporate-controlled media, speeches by Democratic Party politicians, or commentary by the pseudo-left groups. Moreover, the income and poverty rates in the two areas are comparable: both white and black victims of police violence live in lower-income working-class areas characterized by much higher than average poverty rates.
There were 124 (25.9 percent of whites killed) in population centers (excluding suburbs) with more than 100,000. Of these, 66 whites (13.8 percent of whites killed by police and 6.7 percent of all victims) died in large urban centers with more than 300,000 population. The median household income and proportion in poverty were $48,675 and 18.5 percent, respectively. Sixty white people were killed in suburbs, accounting for 12.5 percent of whites killed. These regions have a median household income and proportion in poverty of $69,082 and 8.0 percent, respectively.
The demographics of Hispanics killed by police were closer to those of blacks than whites, in that more were killed in larger urban centers. Rural areas accounted for 40.9 percent of Hispanics killed by police (8.6 percent of all victims) while 59.1 percent of Hispanics (12.5 percent of all victims) were killed in urban centers, including the suburbs and metro areas.
The most dangerous area: rural America
Metropolitan centers denote urban centers with more than one million people. There were ten such centers in which 76 people were killed. This region contributed 28.4 percent of USA− but accounted for only 7.7 percent of those killed. Blacks and Hispanics accounted for 35.5 percent each to those killed while whites were only 27.2 percent. Blacks were over-represented in metropolitan centers, at almost twice their proportion in the population.
Large cities included urban centers between 300,000 to one million people. There were 152 people killed in 46 cities and large suburbs. This region accounted for 27.4 percent of USA− but contributed to 15.4 percent of those killed. Blacks again were over-represented in these regions at nearly twice the expected rate, comprising 40.1 percent of those killed.
Population centers with more than 100,000 people but less than 300,000 included many small cities and exurbs. In these regions, 171 people were killed. Combined, they contributed 22.7 percent of USA- and contributed to 17.3 percent of those killed. The rate of whites killed rose while that for blacks declined to a level more consistent with their population in these regions though blacks continued to be over-represented.
Together these urban centers accounted for 399 killed, making up 40.4 percent of those killed by police in 2017. These areas, however, represented 78.5 percent of the population in USA−, the combined regions where police killings occurred. By contrast, the rural regions, which encompassed 463 small and medium towns, including counties with less than 100,000 people, accounted for only 16.8 percent of USA−. However, they accounted for 50.2 percent of the people killed by police, a remarkable 496 victims.
By comparison to urban centers where death rates are on the order of magnitude less than one killed per 100,000 people, medium-sized cities had a rate for whites of 1.946, blacks 3.564 and Hispanics of 2.259. In small towns and rural areas, these rates climbed to a staggering 12.016 per 100,000 for whites, 15.703 for blacks and 11.755 for Hispanics.
Behind the epidemic of police killings in America: Class, poverty and race
Part three
By Benjamin Mateus
22 December 2018
St. Louis and Ferguson
There are 110 suburbs and metro areas represented in the jurisdictions in which police killed civilians, accounting for 121 killed (12.3 percent) while they made up 7.4 percent of the population in USA−. The mean household income for these regions was considerably higher than the national average at $68,100, the proportion in poverty much lower, at 9.3 percent. Blacks were overrepresented among the victims, making up 19.8 percent of those killed though representing 8.3 percent of that population.
As stated earlier, blacks killed by police are over-represented in urban centers, with the proportion double their percentage of the population. We undertook a ZIP Code analysis of several cities (Chicago, New York, Philadelphia, Milwaukee, Jacksonville, Kansas City and St. Louis) by mapping the location of the killing as reported in the news. The demographics for these were then found through the US Census Bureau website. We will use St. Louis as a case example of our findings as they were essentially repeated in each of these cities, although St. Louis has the highest rate of police killings, underscoring that the rebellion over the killing of Michael Brown in Ferguson, a nearby working-class suburb of St. Louis, was in response to a more generalized sense of outrage.
The population of St. Louis is 311,404. The median household income is significantly lower than the national average at $36,809 with 26.7 percent of the population living in poverty. The demographics have non-Hispanic whites at 42.7 percent, blacks or African-Americans at 47.9 percent and Hispanics at 3.9 percent. Seven of the twelve people killed (58.3 percent) were black. Not only are blacks shot in predominately black neighborhoods, but they are also the poorest with median household income even below the city average and poverty levels three times the national average. St. Louis also ranks as the city with the highest rate of police killings. The table below indicates that it leads with twice the rates of killing compared to Glendale, AZ, part of the Phoenix metro area, which has 16.3 killed per million. Interestingly, large metropolitan areas such as New York, Chicago or Los Angeles have much lower rates.
How the states compare
A state by state analysis provided the following findings. California had the most killings at 162, though it ranked 17 in the rate of killings. Texas had 69 killed and ranked 32. Florida had 58 killings and ranked 30. Arizona had 44 killings ranking 6 and Washington had 38 killings and ranked 14. Missouri with 31 killings ranked 31 and Illinois with 20 killings ranked 43. Nebraska was the only state that had no killings reported.
Nineteen states and the District of Columbia had fewer than ten police killings, making further statistical analysis inaccurate due to small numbers. These states only accounted for fifteen African-Americans killed (6.5 percent of all blacks killed), because they had, for the most part, small black populations. Only Connecticut, Delaware, Maryland and the District of Columbia had a black population of more than 10 percent. Twelve states had no African-Americans killed by police.
Of the remaining 31 states, 16 states had higher observed numbers of African-Americans killed than would be expected based on their population. For instance, in California, there were 23 black persons killed (14 percent) while they make up only 6.5 percent of the population. The P-value at 0.0001 means this discrepancy is highly significant. The other states with disproportionate numbers of African-Americans killed by police included Florida, Illinois, Indiana, Louisiana, Michigan, Missouri, New Jersey, New York, North Carolina, Ohio, Oregon, Pennsylvania, Texas, Washington, and Wisconsin. Again, southern states with the worst history of racial oppression—Mississippi, Alabama, Georgia and South Carolina—had no significant racial component to their police killings.
When considering only the cities, towns and counties where police killings actually took place, i.e., Florida− instead of Florida, the racial disparity became non-significant in nine of the 16 states: Florida, Indiana, Louisiana, Michigan, New Jersey, North Carolina, Ohio, Pennsylvania, and Wisconsin. Only California, Illinois, Missouri, New York, Oregon, Texas, and Washington had persistent higher than expected rates of blacks killed.
For Hispanics, only New Mexico and California were statistically significant for higher than expected killings.
When the data was analyzed for mean household incomes and percentage in poverty, the regions in which the killings occurred had lower income and higher poverty than compared to their respective state as a whole except as noted in Table 2. Only four states, all with small numbers of police killings, showed deaths occurring in areas with higher income. Only seven states, with similarly small numbers of police killings, showed lower poverty levels in areas where killings took place.
We also compared the reported rates of gun involved, weapons used, and those unarmed within this cohort of police killings. There was no significant racial difference in these categories.
Of the women in the cohort who were killed, 35.6 percent had mental illness, compared to men with mental illness accounting for 23.4 percent, a large difference which was statistically significant. Also, white and Asian victims had a higher rate of mental illness as compared to blacks and Hispanics. Whites had a rate of 29.6 percent compared to blacks at 17.6 percent.
Tragically, people with mental illness were more likely to face off against the police than to flee. Of 228 people with mental illness, 85.1 percent did not run away. Of 709 people without mental illness, 57.1 percent did not flee.
Summary and conclusions
When we begin to pore over the number of blacks or whites killed by the police, there is a danger that we both legitimize and disregard the overarching question as to why the police kill so many people year after year.
As the data has shown, the US is not a homogenous nation and there are wide variations in income, poverty level and racial composition, and between urban, suburban, small town settings. Blacks are killed in vastly disproportionate numbers in larger urban centers and continue to be over-represented in smaller urban centers. However, half of all police killings occur in rural areas where the majority is non-Hispanic white, though these areas represent a much smaller fraction of the national population. It is here where white deaths begin to “catch up” to black deaths, and ultimately surpass them.
This data may seem surprising, but it gives credence to the perspective that the focus of many of the most recent high profile police shootings was in large urban centers where blacks were the victims. Poor whites are in essence invisible to the national discussion on police killings. What the present data show is that what whites and blacks who are killed by police have in common is poverty. Rural communities are devastated by low wages and the opioid crisis, rising suicide rates and limited access to social services. This may well be a contributing factor to the higher rate of mental illness seen among white victims of police violence, compared to blacks and Hispanics.
The state-to-state variation also corroborates our hypothesis and method. These figures also demonstrate that the regions within states where killings occur tend to lower median household income and higher levels of poverty as compared to the state as a whole.
With regards to the lower than expected rates of Hispanics being killed by police, the finding remains speculative and requires study. We mapped all the killings by race. Where blacks and whites live throughout the country, and are killed by police in 49 of the 50 states, Hispanics are killed predominately along the Mexican border and the Eastern seaboard. Of the nearly 59 million in the Hispanic populations, as many as ten million may be illegal immigrants. The majority of Hispanics in the US are foreign-born or the first generation born in the US. Their historical experience and cultural backgrounds may contribute to these lower rates of police killings despite sharing similar poverty rates as African-Americans.
Since the financial crisis of 2008, conditions for the working class have become direr as well-paying jobs with benefits have essentially been erased and replaced with low wage labor. Foreclosures, homelessness, and unemployment in inner cities have become a permanent reality for them. A report by Paul Jargowsky of the Century Foundation titled, “Architecture of Segregation: Civil Unrest, the Concentration of Poverty, and Public Policy,” noted that “neighborhoods of extreme poverty where 40 percent live at or below the poverty level have doubled since 2000 from 7.2 million to 13.8 million (5 million Blacks, 4.3 million Hispanics, and 3.5 million non-Hispanic Whites.)”
The report also notes a 76 percent increase in high-poverty census tracts (above 40 percent living in poverty), to 4,412 in 2013, affecting blacks most. The number of census tracts with poverty ranging from 20 to 40 percent has increased by 55 percent to 17,391 in 2013. However, the growth in poverty has been fastest for non-Hispanic whites.
The report also notes that small to mid-sized metropolitan areas where population ranges from 250,000 to one million people have experienced the greatest increase in concentrated poverty. This is congruent with our analysis of city rankings of police killings, in which St. Louis topped the list, followed by a number of other medium-sized cities. Large metropolitan areas where concentrated poverty remains high have had more stability by comparison.
In metropolitan areas, wealthy suburbs have used exclusionary zoning to prevent the establishment of affordable housing, keeping low-income people out. According to Jargowsky, “The whole process is legally enforced through zoning, and underwritten by the mortgage interest deduction and all the subsidies that go into building roads, sewers, and schools for new suburbs … The concentration of poverty is the product of larger structural forces, political decisions, and institutional arrangements that are too often taken for granted. Our governance and development practice ensure that significant segments of our population live in neighborhoods where there is no work, where there are underperforming schools, and where there is little access to opportunity.”
It shouldn’t come as a surprise that the police patrol the boundaries between the affluent neighborhoods and poverty zones. But aside from protecting the property of the affluent, the police function to protect the state apparatus from the disenchantment of the working class. As Trotsky noted, “The bourgeoisie invariably and unswervingly follows the rule: ‘the main enemy is in one’s own country.’”
It is difficult to dispute this observation even today. In recent decades there has been a rapid militarization of the police force as was witnessed in Ferguson, Missouri, after the Michael Brown killing, and in Boston after the 2013 Boston Marathon bombing. There are approximately 750,000 police officers in the US working within 17,985 agencies. Seven percent growth in the next decade is expected. Their annual budget exceeds $150 billion. Oakland and Chicago police budgets account for nearly 40 percent of their general fund. The police budgets for New York, Los Angeles and Chicago exceed one billion dollars per year. This force, second in size only to the US Army, is needed to defend the ruling class from the “enemy within.”
Despite the overwhelming evidence of the role of socio-economic factors related to the class structure of American society, the Democratic Party and its affiliates like Black Lives Matter, the Democratic Socialists of America and other pseudo-left organizations hide behind a racial narrative to account for the crisis of police violence and attempt to enforce reform measures such as ensuring that the demographics of the police force mirror the communities they “serve.” The truth is that a black policeman in Detroit is not serving black people or the “black community,” he is serving General Motors, Detroit Edison, Comerica Bank and the rest of the capitalist class, playing the same role as a white policeman. And as a point of fact, blacks make up 12 percent of the police force nationwide, roughly the same as their proportion in the population.
The pseudo-left groups promote racialist conceptions to defend the capitalist economic system in which their own material interests are rooted, one in which a tiny fraction of the population, less than one percent, controls the vast bulk of the resources and relies on the police as a vital line of defense for its wealth and privileges.
By George Gallanis
For fifth year in a row, US police kill more than one thousand
By George Gallanis
7 January 2019
Under growing social inequality and an upsurge in the class struggle, the year 2018 marked the fifth year in a row that police killed more than 1,000 people across the United States.
The fact that thousands of people, the vast majority of them working class and poor, have been killed at the hands of the police in just the last five years is an expression of the brutality of capitalist rule and the immense scale of social inequality in the United States. As American imperialism ravages nations across the world by means of military violence, it increasingly brings the war home in the form of brutality and murder by an increasingly militarized police force.
Following the police killings of Michael Brown, Freddie Grey, Philando Castile and Laquan McDonald, to name only a few of the most notorious cases since 2014, the police continued their murderous rampage in 2018:
• In March, police in Sacramento, California shot unarmed Stephon Clark, a 22-year-old African American man, 20 times in his grandparents’ backyard.
• On April 5, police shot and killed Diante Yarber, 26, in Barstow, California, claiming afterward that he was driving toward them. The father of three daughters was fired on 30 times and hit approximately 24 times. His lawyer described the incident as the worst form of “excessive and unnecessary force” he had ever seen.
• In May, 54-year-old John Corneil was shot and killed in rural Maine after carrying a toy weapon.
• In June, unarmed Anthony Marcel Green, 33 years old, was killed by police as he fled from police in Kingsland, Georgia.
• In late July, 25-year-old Daniel Hambrick was shot in the back and killed as he ran from a traffic stop in Nashville, Tennessee.
• In September, Dereshia Blackwell, a 39-year-old black woman armed with a gun and knife, was shocked with a stun gun and then shot and killed by police in Missouri City, Texas.
• In October, police in Monroe County, Georgia shot and killed Ida Christy Stiles, a 42-year-old white woman while she was holding a toy weapon.
• In November, 33-year-old Christopher William Parrish, a white male, was shot and killed in Ogden, Utah. Police stated he was armed with a rock.
As of this writing, Mapping Police Violence (MPV) reports that police killed 1,122 people in 2018, somewhat less than the 1,147 reported the previous year. In all of 2018, there were only 22 days when police did not kill someone.
MPV defines police killings as a “case where a person dies as a result of being chased, beaten, arrested, restrained, shot, pepper sprayed, tasered, or otherwise harmed by police officers, whether on-duty or off-duty, intentional or accidental.”
According to the Washington Post, which only tracks police shootings and does not include other types of police killings, such as taserings and beatings, police killed 996 in 2018, slightly higher than their total of 987 from 2017.
The online aggregator Killedbypolice.net, which defines police killings similarly to MPV, stopped tracking police killings in July of 2018, citing financial strains.
The finding that over a thousand people have been killed for the fifth year in a row is based on data gathered by Killedbypolice.net and MPV. Killedbypolice.net reports that US police killed 1,114 people in 2014, 1,222 in 2015, 1,171 in 2016 and 1,194 in 2017.
Combined with MPV’s data showing that police killed 1,122 people in 2018, the total number of people killed by US police over the past five years is 5,923, more than the total number of US soldiers killed in combat in Iraq since the 2003 invasion.
Yet, for all the thousands killed, cops are rarely ever charged or, if charged, convicted. According to research by Philip Stinson, an associate professor of criminal justice at Bowling Green State University in Ohio, between 2005 and April 2017, during which thousands were killed by police, only 80 police officers were arrested for murder or manslaughter.
In 2015, during the Obama administration, MPV found that 99 percent of police killings resulted in no conviction of a police officer. This is in part because capitalist law in the US gives police officers immense leeway to violently attack civilians under the legal doctrine of “perceived threat.” The proclaimed perception of being under threat is sufficient to exempt a cop from conviction for using deadly violence, even if the victim turns out to have been unarmed.
It is also because the Democratic Obama administration, no less than Republican ones, defended the “right” of the police to employ violence against workers and young people. In fact, the Obama Justice Department repeatedly intervened in the federal courts on the side of the police in cases where victims of police violence or misconduct sued for redress.
At the same time, Obama sought to cover up his defense of police brutality and divert the anger of tens of thousands who protested against police killings by framing the question entirely as a racial issue, thereby obscuring the more fundamental social and class issues.
Although African Americans are killed by police in numbers disproportionate to their share of the US population, reflecting in part the racism of cops, the largest number of those killed by police are white—the Washington Postreported that in 2018 police killed 397 white people and 209 black people—and the most important factor in determining who is targeted by the police is social class. The victims of police violence are overwhelmingly working class and poor, of all races and ethnicities.
Perhaps most striking and revealing is the response by the pseudo-left to the continued bloodletting by American police . Calls for protests to police killings by pseudo-left organizations, such as the Democratic Socialists of America (DSA), the International Socialist Organization (ISO), and Black Lives Matter (BLM), have declined dramatically in recent years. These groups, who represent not the interest of the working class but of upper-middle-class layers, have sought to portray police killings primarily as the product of racism within American society.
Touted as the leading organization against police killings by the bourgeois media, BLM, which created the popular hashtag #blacklivesmatter, has expressed this the most sharply.
During the mass popular protests in Ferguson, Missouri in which workers and youth protested over the police killing of Michael Brown by Darren Wilson, the mainstream media declared BLM as the leaders of the protest. This was part of the ruling-class effort to divert the anger of workers and youth into the dead-end politics of BLM, which operates in the orbit of the Democratic Party.
There is a genuine fear among the ruling class that a new mass protest against police violence could spark a wider movement that might develop into a political movement against capitalism.
The protest of Ferguson and the subsequent events that followed expressed a growing radicalization among workers and youth in the United States. The American ruling class took note and has sought to avoid the recurrences of larger protests. It has relied on BLM and other pseudo-left groups to divert workers and youth into the dead end of identity politics.
Since its inception over five years ago, BLM, which has thoroughly integrated itself into the Democratic Party and received a $100-million-dollar grant from the Ford Foundation, has all but abandoned its calls for any type of mass action or protest against police killings and has focused its efforts on reformist police policies and promoting Democratic candidates.
Alicia Garza, one of the three cofounders of the BLM movement, stated openly in 2017 that BLM has moved away from protests. She said, “What people are seeing is that there are less demonstrations. A lot of that is that people are channeling their energy into organizing locally, recognizing that in Trump’s America, our communities are under direct attack.”
Patrisse Cullors, also a cofounder of BLM, told Mic in July 2018, “I’m so grateful that in this time, especially under this current government, that we created a movement five years ago. It gave us a blueprint on how you fight back. We’ve seen the Women’s March. We’ve seen the March for Our Lives. They’ve used it to change policy, to change culture.”
She later told ABC News, “There are so many different elected officials, both black and white, who are challenging the status quo right now,” commenting that the recent election of Democratic representative and DSA member Alexandria Ocasio-Cortez in New York was “a testament to our movement.”
The unrelenting wave of police killings is an indictment of the bankrupt politics of the pseudo-left and their promotion of racialist politics as an antidote to police violence in the United States. Moreover, their insistence on race as the primary factor in police killings has only created confusion and sown illusions in police reform.
The problem of police violence is ultimately a political one. To understand the nature of the police is to comprehend the dynamics of capitalism and the state. The police are part of the state’s arsenal to carry out the mandates of the ruling elite and ultimately to protect the interests of private property. The state, with its police, military, border patrol and spy agencies, exists as a repressive instrument in the irreconcilable conflict between the ruling class and the working class.
It is dangerously misleading to declare that police repression is fundamentally the result of racism. Such a position makes the problem of police brutality an ideological one, and not a class question bound up with the system of capitalism. It, moreover, promotes the delusion that the police can be rehabilitated or replaced with some other, more “equitable” force under capitalism.
Police murder and violence affect the entire working class, regardless of race. White workers are killed in the largest numbers and bear no special privilege from the brutality of the police.
An analysis of police killings for the year 2017 conducted by the World Socialist Web Site found that working-class white men in rural areas are killed at similar rates to those of black men in cities and urban areas. The report also found that the majority of those killed came from working-class and poor backgrounds, making clear that class, not race, is the ultimate factor in police killings.
The killing of people in primarily working-class and poor areas is the direct and indirect expression of class rule. In promoting a racialist narrative, BLM, the DSA, the ISO and others aim to divide the working class and channel social opposition back behind the pro-capitalist Democratic Party and in doing so defuse popular opposition to state violence.
The author also recommends:
No comments:
Post a Comment