America Faces No Greater Threat Than Joe Biden and the Democrat Party. Their Assault to Our Borders Is As Great As Their Assault to Free Speech and Free Elections
Friday, December 10, 2021
JOE BIDEN'S COVID AMERICA UNRAVELS - No money for COVID tests, blank check for the military
Hospital CEO: Covid patients are dying ‘at a rate we’ve never seen before’
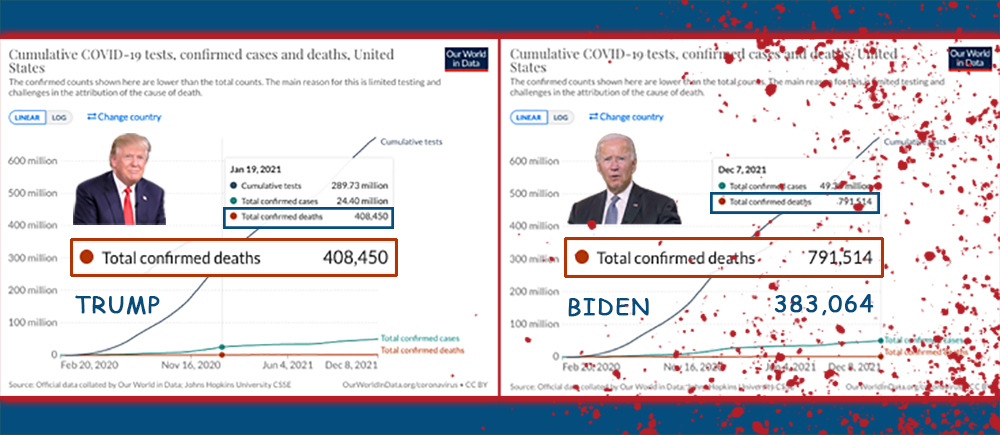
The Washington Free Beacon doesn't always make political projections, but when we do, we prefer to be bold. We believe that by the end of the year, President Joe Biden will achieve a historically gruesome milestone by presiding over more American deaths from COVID-19 than his predecessor, Donald Trump.
According to the scientific experts and reliable data nerds at Johns Hopkins and the New York Times, Biden trails Trump by just 25,386 deaths as of Dec. 7. Despite the president's pledge to "shut down the virus, not the country," Americans are still dying from COVID-19 at a rate of about 1,300 per day. The economy, meanwhile, continues to flounder under Democratic control.
Based on Biden's daily death rate of 1,300, a sophisticated data extrapolation suggests the president will surpass Trump's COVID-19 body count on Dec. 27. Biden's broken promise is yet another example of his failed leadership. According to Biden's own logic, he has "disqualified" himself from serving as president.
During his final presidential debate against Trump in 2020, then-candidate Biden argued that any leader who presided over 220,000 deaths from COVID-19 "should not remain as president of the United States of America." Perhaps an enterprising professional journalist will ask Biden to explain why he should remain in office as his body count surges past 400,000 and into the record books. That probably won't happen, but the historic death count should make for an interesting State of the Union address early next year.
We at the Free Beacon are literally shaking right now. Instead of fulfilling his pledge to "shut down the virus," Biden looked on as his COVID-19 body count surpassed the total number of U.S. combat deaths (344,959) in World Wars I and II. Meanwhile, the president and his Democratic allies continue to recklessly reject science by violating indoor mask mandates to party with billionaires and celebrities.
Shame!
US: No money for COVID tests, blank check for the military
On Wednesday, White House spokesperson Jen Psaki rejected the idea of sending free COVID-19 tests to all Americans to protect against the dangerous new Omicron variant, pressing reporters, “How much would that cost?”
At wholesale prices of approximately $1 per test (the going price in Germany), it would cost approximately $329 million. Sending every single American a COVID-19 test would cost the equivalent of less than one-tenth of 1 percent of the military budget, the largest in history, passed Friday by the US House of Representatives.
In other words, the military budget is 2,000 times more expensive than this critical measure to protect Americans against COVID-19, the single greatest threat to their lives, more deadly than cancer, heart disease, smoking and auto accidents.
The massive budget weighs in at $740 billion, with another $28 billion thrown in for the US Department of Energy to develop additional nuclear weapons.
Former President Donald Trump repeatedly boasted of his record military budgets. But this budget is tens of billions of dollars larger than anything ever passed under Trump—a budget far, far larger than even the Biden administration or Pentagon asked for.
The 2022 National Defense Authorization Act, the summary of which alone is over 600 pages, was released just six hours before the overwhelming majority of lawmakers in both parties voted on it.
An F-35 production line (Credit: Lockheed Martin)
Included in the bill are, to quote the official summary of its weapons systems:
“$4.9 billion for Arleigh Burke-class destroyers, an increase of $2.9 billion to build three guided missile destroyers in fiscal year 2022.”
“A $4.7 billion increase for shipbuilding, including 5 additional battle force ships: 2 destroyers, 2 expeditionary fast transports, and 1 fleet oiler”
“$3.1 billion for the Columbia-class submarine program, an increase of $130 million, for industrial base development and expansion in support of the Virginia and Columbia shipbuilding programs.”
“$6.6 billion for the procurement of two Virginia-class submarines and advance procurement of future submarines, including an additional $200 million to expand the submarine industrial base.”
“$4.4 billion for the F-35A program, including an increase of $175 million for the purchase of F135 power modules and the resources to begin upgrading the fleet to TR-3/Block 4 capability.”
“$1.0 billion for 12 F/A-18E/F aircraft”
It includes further lump-sum appropriations for “great power” conflicts against Russia and China:
“Extends and modifies the Pacific Deterrence Initiative (PDI) to realign DOD efforts towards PDI objectives and identifies approximately $7.1 billion in FY22 investments [to counter China]”
“Increases funding by $50 million for the Ukraine Security Assistance Initiative, which authorizes the Secretary of Defense, with the concurrence of the Secretary of State, to provide security assistance and intelligence support to military and other security forces of the Government of Ukraine [as part of a military-buildup challenging Russia]”
But the largest portion of the bill deals with funding the United States multi-trillion-dollar nuclear buildup, focusing on the creation of smaller, more “usable” nuclear weapons:
“Authorizes $20.2 billion for the activities of the NNSA [National Nuclear Security Administration]”
“Authorizes $6.48 billion for the Department of Energy’s defense environmental cleanup activities”
Commenting on this bloated handout to defense contractors, journalist and historian Fred Kaplan asked, “Did anyone even look at the massive defense budget before passing it?”
Kaplan added, “No officials or lawmakers have spelled out why the budget—which includes $740 billion for the Pentagon and $28 billion for the Energy Department’s nuclear-weapons programs—needs to be quite this huge.”
Kaplan adds,
Critics of government spending on domestic programs frequently complain about “throwing money at a problem.” Yet that is exactly what Congress is doing with the defense budget. When Biden submitted his infrastructure and Build Back Better plans, a few legislators from both parties got together with the White House to pare down their size, narrowing the definition of “infrastructure,” reordering priorities, and questioning the urgency of some needs. One can argue about the final result, but Congress subjected Biden’s plan to legitimate oversight and analysis.
There has been almost no oversight or analysis of this defense budget.
With inflation soaring to levels unseen in decades, all US fiscal spending is being reviewed with a fine-tooth comb. The vast majority of social spending projects, including child care and student loan forgiveness that Biden campaigned on, are being thrown out the window, based on the claim that additional government spending will contribute to inflation.
And yet, when it comes to the military, anything goes. The generals simply get everything on their Christmas wish list and then more in the form of unspecified and unenumerated slush funds.
The dominant thinking driving this insane level of military spending was outlined in a new book by Elbridge Colby, a lead author of the US 2018 national defense strategy, as well as the 2018 essay, “If You Want Peace, Prepare for Nuclear War.” In his latest book entitled The Strategy of Denial: American Defense in an Age of Great Power Conflict, Colby writes,
Pandemics do not put geopolitics on hold; power politics exists even during and after such outbreaks. They may even intensify geopolitical competition. … This means that, while the effort and expense required to control the threat of pandemic disease may be very great, these efforts do not logically trade against national security requirements.
But, as economists like to say, “All dollars are green.” A $70 million spent on an F-35 is 70 million Americans who do not get a COVID-19 test.
What is behind America’s binge in military spending? As the World Socialist Web Site warned in October, “Under conditions of deepening social, political and economic crisis, dominant sections of the American ruling class see a conflict with China as a mechanism for enforcing ‘national unity,’ which means, in practice, suppressing and criminalizing domestic opposition.”
If American capitalism cannot afford to protect the population from COVID-19, it at least has the resources to use a foreign conflict as a pretext for a crackdown at home.
To get an idea of just how dangerous the current Covid vaccines are, we only need to look at the numbers in the government-authorized VAERS database.
As you may know, VAERS is an acronym for Vaccine Adverse Event Reporting System. This system is co-maintained by the U.S. Centers for Disease Control and Prevention (CDC) and the Food and Drug Administration (FDA). This is how the FDA describes this facility on its website:
“VAERS is an early warning system used to monitor adverse events that happen after vaccination. VAERS is the frontline system of a comprehensive vaccine safety monitoring program in the United States… VAERS gives vaccine safety experts valuable information so they can assess possible vaccine safety concerns, including the new COVID-19 vaccines. It is especially useful for detecting unusual or unexpected patterns of health problems (also called “adverse events”) that might indicate a possible safety problem with a vaccine.”
Established in 1990, the idea behind VAERS is to capture as many adverse reactions to vaccines as possible in order to alert health experts to potential issues and problems.
The graph below traces the number of deaths that have been reported to VAERS every year since its inception. As you can see, the yearly levels have held relatively steady from 1990 until 2020 and were generally under 400 cases. The cumulative total of all reported deaths during those years comes to 5,178 (see VAERS analysis here).
This, however, changed dramatically toward the end of 2020 when the Covid vaccines were introduced. At that point, we see a rapid explosion in reported deaths. So exponential was the increase that the graph line shoots up almost vertically.
As of November 26, 2021, the number of deaths reported to VAERS in connection with the Covid vaccines was 19,532. It is both astonishing and revealing that in the last 11 months there were more reports of vaccine deaths related to Covid shots than to all other vaccines combined during the previous three decades.
This should raise all kinds of red flags because it is a good indication that there may be something seriously wrong with the Covid vaccines, and that these hastily authorized pharmaceuticals are causing death on an unprecedented scale.
The 19,532 tally does not, however, give us an accurate picture of the situation. To get a sense of the true state affairs, this number needs to be adjusted for two very important factors. The first concerns the nature of VAERS data itself, while the second relates to the way in which it is collected.
Adjustment for causality
To begin with, we need to recognize that not all deaths reported to VAERS are due to the vaccines. To see why, we must understand the difference between a temporal and causal connection. Even though the bulk of reported deaths normally occurs within a relatively short time of vaccination – usually from days to weeks – it does not necessarily mean that all those who have died after having taken the vaccine perished because of it. In some cases, people who appear among VAERS entries died of causes unrelated to the vaccine, and they just happened to receive their injections in temporal proximity of their passing.
In order not to overstate the case when considering VAERS data, it is, therefore, important to keep in mind that reported cases do not necessarily imply causality. The question, then, becomes in what proportion of VAERS entries a causal link can be established.
To help us make this assessment we use the findings of a peer-reviewed study that examined this issue. The title of the study is “Causality Assessment of Adverse Events Reported to the Vaccine Adverse Event Reporting System (VAERS).” The study was published in 2012 and you can view it at this link at the National Library of Medicine.
The study found a “definite” or “probable” causal link between the vaccine and the adverse event in 23 percent of entries in the VAERS database. In another 20 percent of cases, a causal link was “possible.”
In order not to inflate our numbers, we will assume that a definite or a probable link exists in only 20 percent of death entries entered into VAERS in connection with the Covid vaccines. In other words, we will assume that in 8 out of 10 entries, the vaccines were not responsible for the demise of the person. We will take this cautious position despite the fact that in most cases the filing party – mostly health care professionals – believed that the reported deaths occurred as a result of the vaccine. To put it in a different way, we will assume that the filers were mistaken 80 percent of the time.
When we adjust the 19,532 figure for this variable, we obtain 3,906 (19,532 x 0.2). This would be the number of deaths that were definitely or likely attributable to the Covid vaccines per the VAERS records.
Adjustment for underreporting
This number, however, does not accurately reflect the real death toll of the vaccines. This is because it is well known that the VAERS numbers are vastly underreported.
The under-reporting is due to a host of reasons. Most doctors, for example, are hard pressed for time and they do not wish to go through the time-consuming administrative process of filing claims, which is a task for which they receive no compensation. Doctors are also generally discouraged by the environment in which they work from reporting this kind of data in order not to shed a bad light on pharmaceutical products, which are the lifeblood of modern medicine. Be that as it may, it is an undisputed fact that only a very small fraction of the actual adverse events end up being reported to the VAERS database.
A number of authorities believe that fraction to be one percent or less. One of them is Dr. David A. Kessler, a former FDA Commissioner who – in support of his 1993 article thesis – referenced a study that found that “only about 1% of serious events are reported to the FDA.”
Kessler should know of which he speaks since in addition to his high-profile appointments as a public health official he also holds a Medical Degree from Harvard and a law degree from the University of Chicago.
Kessler’s view was reaffirmed by a 2010 report by Harvard Pilgrim Healthcare for the U.S. Department of Health and Human Services which concluded that "fewer than 1% of vaccine adverse events are reported" (see page 6 of the report).
Ronald A. Kostoff is another high-profile scientist who believes that one percent is the correct estimate. In a recent paper he observed, “historically, VAERS has been shown to report about 1% of actual vaccine/inoculation adverse events.”
If these authorities are correct, then the underreporting factor (URF) of the VAERS database is 100.
To ensure that they err on the side of caution rather than the other way around, some researchers use a more conservative URF in their analysis. Steve Kirsch, for example, generally uses the underreporting factor of 41 in his calculations. The lowest URF factor this writer has come across in the work of credible analysts is 36. In order to be as conservative as possible, we will use this figure in our analysis.
If we, then, adjust our VEARS number for this variable, we will obtain the result of 140,616 (3,906 x 36). This would represent the number of Americans killed by the Covid vaccines in a period of fewer than 12 months starting in mid-December 2020 through November 26, 2021.
Observations
Please keep in mind that the above is a very conservative estimate, which we have arrived at by assuming a 20 percent causality link in reported death entries in the VAERS database and the underreporting factor of 36. This, however, is likely a gross understatement of the actual situation.
Using less conservative assumptions, many researchers have come up with a higher death toll. Steve Kirsch, Jessica Rose, and Mathew Crawford, for example, estimated in their paper that the vaccines have likely claimed 150,000 lives as of August 28, 2021.
If we use the underreporting factor of 100 (one hundred) advocated by David A. Kessler, Ronald Kostoff, and the Department of Health and Human Services we would arrive at the figure of 390,600 deaths attributable to the vaccines.
It is quite probable that these figures are closer to the actual vaccine death toll than the one we obtained based on our cautious assumptions.
Be that as it may, we can say with a considerable degree of confidence that based on the VAERS figures, it is very likely that the Covid vaccines have killed or directly contributed to the deaths of at least 140,000 Americans.
By claiming the lives of so many people in such a short time, the Covid vaccines are the deadliest pharmaceuticals ever released into wide circulation.
Correction: comparison of causialties in Vietnam War was deleted.
The World Inequality Report 2022, released by the global research initiative World Inequality Lab, found that the COVID-19 pandemic has widened the financial gap between the rich and poor to a degree not seen since the rosy days of world imperialism at the turn of the 20th century.
The world’s billionaires enjoyed the steepest increase in their share of wealth last year since the World Inequality Lab began keeping records in 1995, according to the study released Tuesday. Billionaires saw their net worth grow by more than $3.6 trillion in 2020 alone, increasing their share of global wealth to 3.5 percent. Meanwhile, the pandemic has pushed approximately 100 million people into extreme poverty, boosting the global total to 711 million in 2021.
“Global inequalities seem to be about as great today as they were at the peak of western imperialism in the early 20th century,” the report said. “Indeed, the share of income presently captured by the poorest half of the world’s people is about half what it was in 1820, before the great divergence between western countries and their colonies.”
People ride their bikes past a homeless encampment set up along the boardwalk in the Venice neighborhood of Los Angeles, June 29, 2021. (AP Photo/Jae C. Hong)
The report showed the wealthiest 10 percent of the world’s population takes 52 percent of global income, compared to the 8 percent share of the poorest half. On average, an individual in the top decile earns $122,100 (€87,200) per year, while a person from the poorest half of global earners makes $3,920 (€2,800) a year.
Global wealth inequality is even more pronounced than income inequality. The poorest half of the world’s population only possess 2 percent of the total wealth. In contrast, the wealthiest 10 percent own 76 percent of all wealth, with $771,300 (€550,900) on average.
The ultra-rich have siphoned a disproportionate share of global wealth growth over the last few decades. The top 1 percent took 38 percent of all additional wealth generated since 1995, whereas the bottom 50 percent have only captured 2 percent of it. The wealth of the richest individuals has grown between 6 to 9 percent per year since the mid-1990s, compared to the global 3.2 percent average.
Inequality levels vary across the regions. In Europe, the top decile takes about 36 percent of income share, while it holds 58 percent in the Middle East and North Africa. However, inequalities between countries have declined in the last two decades, whereas inequality within “rich” countries has risen sharply. In the United States, the top 1 percent owned 35 percent of the country’s wealth, approaching Gilded Age levels of inequality.
This massive accumulation of capital has come at the expense of public wealth over the last four decades. The share of wealth held by public actors is close to zero or negative in “rich” countries, indicating that the totality of wealth is privately owned, a trend exacerbated by the coronavirus pandemic.
The report also studied connections between wealth inequality and inequalities in contributions to climate change, showing the top 10 percent of emitters are responsible for close to 50 percent of all greenhouse gas emissions, while the bottom half produces 12 percent of the total. This disparity is also seen within nominally rich countries. The bottom half of the population in Europe, East Asia, and North America is responsible for an average of 3 to 9 metric tons of emissions per person a year. This contrasts sharply with the emissions of the top 10 percent in these regions: 29 metric tons in Europe, 39 in East Asia, and 73 in North America.
Given this diverse and severe inequity, the authors of the report propose a series of “modern progressive taxes” on wealth used to invest in education, health, and ecological restoration.
But such a path is a dead end; All the official and semi-official institutions of government are subordinated to the interests of the financial aristocracy and serve to constrain and block any measure that threatens their hoards of wealth.
This is demonstrated by the disastrous response to the COVID-19 pandemic, with governments around the world declaring the pandemic over and eliminating remaining protective measures. Rather than being driven by concern for public health, the actions of governments have been driven by the effort to protect the wealth and privileges of the upper echelons of society.
The glaring contradiction between the world’s richest people and the precarious circumstances billions are living in is fueling a growing wave of working class militancy. The working class must demand the massive amount of wealth and resources hoarded by the wealthiest layers be seized and directed to fight the global pandemic.
The chief obstacle to solving the world’s burning social questions—whether the devastating impact of COVID-19 or the widespread growth of inequality—is the private profit interests of the capitalist ruling class. To save lives and avert even further disaster, workers must build an international socialist movement based on the interests of the working class.


No comments:
Post a Comment