The Awful Future that Looms for a Majority of Today’s Americans
By Steve McCann
When it comes to the future, an overwhelming majority of Americans
have adopted a mindset that is a variation of Isiah 22:12: “Let us eat, drink
and be merry for tomorrow does not matter.” Recently, federal debt
surpassed the $20 Trillion mark (additional state and local debt amount to
another $2.9
Trillion). That milestone was greeted by the Ruling Class and a vast
preponderance of the citizenry with a yawn and a shrug of the
shoulder. As the ongoing determination to promote new entitlement
spending and the refusal to rein in, but instead to expand, existing programs
continues unabated.
Any attempt to seriously discuss the financial fate of the nation
is ignored and dismissed with the proviso that its someone else’s problem for
another day down the road. In reality, this dilemma is not someone else’s
problem. The average life expectancy in the United States today is
79. That means that over 225 million citizens and non-citizens in the country
today will still be alive in 30 years.
And will be facing 30 years hence? Recently, the Government Accountability
Office as well as a number of experts such as Price
Waterhouse have projected what that scenario will be if the country
remains on its present course (with no new entitlements such as single payer
health care and government mandated and paid maternity leave.) Note: All
dollar amounts are in 2017 Dollars.
A.  Federal, State and local government spending
currently amounts to $7 Trillion per year or 37% of the nation’s Gross
Domestic Product (GDP). By 2048 these entities combined will be
spending in excess of $17 Trillion per year, or over 50% of GDP. As
interest costs on the overall debt will increase from $0.4 Trillion to $2.4
Trillion, healthcare spending (includes Obamacare subsidies) will vault from
$1.6 Trillion to $3.7 Trillion, Social Security and pension payments will grow
from $1.4 Trillion to $3.5 Trillion, education spending from $1 Trillion to
$2.4 Trillion, and welfare programs from $0.5 Trillion to $1.3 Trillion.
Federal, State and local government spending
currently amounts to $7 Trillion per year or 37% of the nation’s Gross
Domestic Product (GDP). By 2048 these entities combined will be
spending in excess of $17 Trillion per year, or over 50% of GDP. As
interest costs on the overall debt will increase from $0.4 Trillion to $2.4
Trillion, healthcare spending (includes Obamacare subsidies) will vault from
$1.6 Trillion to $3.7 Trillion, Social Security and pension payments will grow
from $1.4 Trillion to $3.5 Trillion, education spending from $1 Trillion to
$2.4 Trillion, and welfare programs from $0.5 Trillion to $1.3 Trillion.
B. The dramatic increase in
spending and borrowing combined with the inevitable necessity of increased tax
rates will crowd out private and public investment thereby slowing the growth
of productivity, worker’s wages and the GDP. The Congressional Budget
Office estimates that by 2040 the average annual real income per person
will fall
by $6,000.00. Thus, by 2048 the GDP of the United States will lag
significantly behind China and India, as it falls to third place among the
nations of the world. The U.S. GDP will increase only 76% by 2048 while
government spending increases by 142%.
C. Concurrent with and
because of the spending, stagnant growth and reduced personal income, the
overall government debt will increase significantly as tax proceeds (despite
eventual higher rates) will not generate anything close to the revenue
necessary to offset spending, as tax revenues to the Federal, State and local
governments will not exceed 30% of the GDP, whereas spending will absorb 51% of
the GDP. By 2048 the overall government debt (Federal, State and local
may well exceed $68 Trillion as compared to $23 Trillion today. Thus, the
interest costs will increase fivefold, as not only does the debt swell, but the
United States will have to appeal to lenders willing to underwrite a nearly bankrupt
nation. Today this country, with 5% of the world’s population, accounts
for over 32% of
Global debt, but by 2048 it will account for 49% of Global debt. In
essence, America will be at the mercy of the rest of the world and a
second-tier economy.
D. Over the next 30 years
there will be inevitable recessions, global financial crises and international
military encounters. The United States will, with this level of
debt and spending, find itself in an increasingly precarious position, as it
may not be able to successfully weather any serious economic downturn or global
conflict.
E.
The above statistics do not include the current Democratic Party’s
love affair with single-payer healthcare or “Medicare for all.” If that
program were included, the annual government expenditures in 2048 (over and
above current healthcare spending and interest costs) would balloon from $17
Trillion to $20 Trillion (60%
of annual GDP) (and the debt would grow from $68 Trillion to over $86
Trillion.
The tsunami that will inundate this nation is inevitable as there
is no willingness, regardless of party, to confront these issues.
The Democrats and their mind-numbed followers, now fully wedded to
socialism, have convinced each other, and unfortunately much of the citizenry,
that there is a bottomless pit of money to be siphoned from the so-called rich
and the golden goose that is Capitalism, the engine of the nation’s GDP, will
continue in perpetuity to lay the gold eggs regardless of any abuse or
restraint. The one-time confiscation of the wealth of all the
billionaires in the U.S. would amount to $2.2 Trillion (less than 31% of all
government spending in 2017). Further, Capitalism cannot thrive without
capital and profit, both of which the Democrats would severely restrict and
control, thus, exacerbating the scenario outlined above.
The Republicans, while cognizant of the dire future ahead, prefer
to hide their heads in the sand and defer matters to another day and another
Congress and another President, as they are fearful of telling the people the
truth and risk losing political power. Thus, their pre-determined
inability and lack of fortitude in addressing Obamacare or any long-term
spending programs.
Donald Trump continues to tout new programs (such as paid
maternity leave), adamantly refuses to address the out of control entitlement
spending, and is content with modified single-payer health care. He
claims that economic growth will take care of all the problems; however, unless
he and his successors find a way to grow the economy at an annual 5-7% per year
for the next 20 to 30 years, that platitude is meaningless (the highest
ten-year period of GDP growth -- 6.7% -- in the past 100 years took place
in 1939-1948,
which included massive war production for World War II). President Trump,
has no plan or desire to mitigate the disaster looming on the horizon
preferring to kick the can down the road while mouthing the usual banalities
about reining in spending.
Thus, the populace, instead of being aware of the disaster ahead,
is taking its lead from the Ruling Class. Alternatively, the American
people are blithely swimming in a sea of banalities and faux causes.
Whether it is promoting transgenderism, drowning in cults of personality,
defacing and tearing down statues, feverously looking for supposed racism under
every rock, asserting hypothetical compassion in the promotion of open borders
and amnesty for untold millions, breathlessly endorsing the false God of
climate change, cheering for their side of the political spectrum to humiliate
the other, or demanding that government make their lives better.
I will not be among the 225 million Americans living today that
will be alive in 2048. I have been fortunate to live throughout the
golden age of America’s power and influence, but regrettably to also see the
impending end of this glorious and short-lived era. The true
tragedy is that those 225 million refuse to understand that for them there is
no tomorrow to disregard.
When it comes to the future, an overwhelming majority of Americans
have adopted a mindset that is a variation of Isiah 22:12: “Let us eat, drink
and be merry for tomorrow does not matter.” Recently, federal debt
surpassed the $20 Trillion mark (additional state and local debt amount to
another $2.9
Trillion). That milestone was greeted by the Ruling Class and a vast
preponderance of the citizenry with a yawn and a shrug of the
shoulder. As the ongoing determination to promote new entitlement
spending and the refusal to rein in, but instead to expand, existing programs
continues unabated.
Any attempt to seriously discuss the financial fate of the nation
is ignored and dismissed with the proviso that its someone else’s problem for
another day down the road. In reality, this dilemma is not someone else’s
problem. The average life expectancy in the United States today is
79. That means that over 225 million citizens and non-citizens in the
country today will still be alive in 30 years.
And what will this nation be facing 30 years hence?
Recently, the Government
Accountability Office as well as a number of experts such as Price
Waterhouse have projected what that scenario will be if the country
remains on its present course (with no new entitlements such as single payer
health care and government mandated and paid maternity leave.) Note: All
dollar amounts are in 2017 Dollars.
Read more: http://www.americanthinker.com/articles/2017/09/the_awful_future_that_looms_for_a_majority_of_todays_americans_.html#ixzz4tEUApC4L
JUDICIAL WATCH:
“The greatest criminal threat to the daily lives of American
citizens are the Mexican drug cartels.”
“Mexican drug cartels are the “other” terrorist threat to America. Militant
Islamists have the goal of destroying the United States. Mexican drug
cartels are now accomplishing that mission – from within, every day, in
virtually every community across this country.” JUDICIALWATCH
AG Sessions Touts Record-Breaking Drug Seizure in San Diego

Alex Wong/Getty Images
Attorney General Jeff Sessions traveled to San Diego, California, Wednesday to tout the record-breaking amount of drugs seized in Fiscal Year 2017.
During the visit, Sessions watched as Coast Guard officials unloaded more than 50,000 pounds of cocaine and heroin seized from drug traffickers at sea. The drugs are worth an estimated $680 million, according to FOX 5 San Diego.
Overall, in the 2017 Fiscal Year, officials revealed that a record-breaking 455,000 pounds plus of drugs had already been seized. In 2016, that number amounted to 443,000 pounds. The 2017 haul is worth an estimated $6.1 billion.
“By preventing overdoses and stopping new addictions before they start, enforcing our drug laws saves lives,” Sessions said in a statement. “I commend every service member who has helped us in our mission to keep the American people safe, and I thank them for this indispensable contribution to public safety.”
Officials with the Coast Guard also revealed that more than 600 alleged drug traffickers have already been arrested in 2017.
“These drugs represent the scale of the threat transnational organized crime poses to our nation and to all peaceful nations of the Western Hemisphere,” Coast Guard Commandant Adm. Paul Zukunft said in a statement. “The Coast Guard and Justice Department, along with interagency partners, are determined to commit our efforts to detect, interdict, investigate and prosecute the entirety of these criminal networks and end the drug fueled instability and violence in the region.”
Sessions’ visit to San Diego to raise awareness to the drug problem crippling the U.S. comes just as New York City officials and federal agents seized a record-breaking 270 pounds of fentanyl–enough to kill 32 million people–Breitbart Texas reported.
The Department of Homeland Security (DHS) estimated that in 2015, at least 52,000 Americans died from drug-overdoses, an industry that Mexican and Latin American drug cartels largely control in the U.S.
Rural New York schools
grapple with declining population, increasing poverty
By
Jason Melanovski
20 September 2017
A recent report has highlighted the dire development of increasing
poverty and declining enrollment many rural school districts are facing across
New York state, forcing these districts to choose between making onerous cuts,
combining with other districts, or closing schools within the district, thus
forcing students to travel longer distances.
According to a report titled “Demographic Challenges Facing Rural
Schools: Declining Enrollment and Growing Poverty” by the New York State
Association of School Business Officials, the dual phenomena of increased
poverty and lower enrollment are wreaking havoc on local school budgets, which
are primarily funded by local property taxes.
Calling enrollment declines “omnipresent,” the report states that
“96.7 percent of rural school districts had declining enrollment and 84.9
percent had drops of at least ten percent.”
While the rate and overall population in poverty is still higher
in New York’s suburban and urban school districts, the poverty rate in rural
areas is increasing at a noticeably faster pace.
From 2003 to 2015, the poverty rate for school-age children
increased from 14 percent to 18 percent for children in rural school districts
and from 19 percent to 21 percent for children in non-rural school districts.
For both rural and non-rural school districts the greatest jump in poverty
rates occurred between 2009 and 2011 following the 2008 financial crisis.
Another measure of the economic plight of school children is the
percentage of children receiving free or reduced priced lunches. In rural
school districts 48.3 percent of students receive free or reduced priced
lunches, and that number rises to 53.2 percent of students in non-rural
districts. A student is eligible for free or reduced priced lunch when his or
her family makes less than 185 percent of the poverty level.
Although the report was released to shed light on the challenges
facing rural school districts, it made clear that poverty among the state’s
school children has no geographic limits. According the report, “The
combination of poverty and Free- and Reduced-Price Lunch (FRPL) data show that
a little more than one in every five schoolchildren in New York lives in
poverty, while a little more than half of all school children face significant
economic constraints at home.”
The report compiled data from the 340 rural school districts,
which make up about half of those in New York State, but serve only a little
more than 11 percent of the students.
The report noted that the population losses and increases in poverty
cannot be separated from the financial crisis of 2008, stating “for a few years
prior to the onset of the Great Recession, growth rates in urban and rural
counties were closely related. Beginning in 2008, rural populations entered a
period of sustained decline, while urban populations continued to grow, though
their pace of growth slowed after 2011.”
According to United States Census data, the emptying of much of
rural America can be directly connected to the shrinking number of jobs in
non-metro areas, as the rural job market is now 4.26 percent smaller than it
was in 2008.
Speaking to the Daily
Star of Oneonta, NY, the rural Delaware Academy School
District’s Superintendent Jason Thomson stated that the current 47 percent of
students who qualify for free or reduced price meals is the “highest we’ve ever
seen.”
In addition, many of the rural counties mentioned in the report
have also been hit hard by the opioid epidemic, claiming the lives of young
workers and reducing an already declining population. Tioga County, for
instance, lost up to 10 percent of its population between 2002 and 2016 and
averaged 16.7 opioid deaths from 2013 to 2015 according to New York state.
With rapidly declining enrollment, rural schools are forced to
count on smaller and smaller budgets with each succeeding school year,
resulting in cuts to classes, teachers, programs and extracurricular activities
and an overall sense of living in a world with scant opportunities for future
life.
As the report states, rural “schools may have to cut back on
valuable academic and enrichment opportunities, from Advanced Placement courses
to music and sports programs, when they no longer have the student numbers
needed for viability. Any potential reductions in college readiness preparation
are incredibly serious. Decreasing enrollment can also increase students’ sense
of isolation as there are literally fewer peers for them to interact with.”
To add to an already dire state of morale in rural schools,
despite the fact that poor rural schools often have significantly higher
graduation rates than poor urban schools, diplomas from rural schools are often
seen as “worthless” according to David Little, executive director of the New
York State Rural Schools Association. Poor rural schools in New York are simply
unable to afford the cost of offering advanced placement (AP) and college-level
coursework that is seen as necessary by college admissions officers.
For its part, the New York state government and the Andrew Cuomo
administration have failed to respond to the demographic and social declines in
rural school districts and increase state aid. The state continues to use a
formula created in 2008, prior to the financial crisis, which categorizes the
majority of rural schools as “average need.” If current demographic and poverty
data were used, the majority of rural schools would now be considered
“high-need,” requiring increased state aid.
Increasing rural poverty is not unique to New York. It has been
rising across the country after falling sharply over many decades to a record
low rate in 2000 of 13.4 percent. 16.7 percent of rural Americans lived in
poverty in 2015, compared to 13 percent in poverty within metropolitan areas,
according to the United States Census Bureau.
US Census report shows
increasing social inequality
By Eric
London
15 September 2017
US Census data from
2016 released on Tuesday shows increasing social inequality amid a small gain
in household income that is offset by a massive growth of personal debt and
rising living costs.
The data tracks the
ongoing redistribution of wealth from the working class to the wealthy as a
result of the pro-Wall Street policies of both the Republican and Democratic
parties. It substantiates the oligarchic character of the United States.
Social
inequality
The Gini index, used to measure social inequality, with higher
figures indicating a wider economic divide, rose slightly from 2015 (.479) to
2016 (.481). The 2016 figure, according to rankings in the CIA World Factbook, makes the
US slightly more equal than Madagascar and less equal than Mexico.
In terms of
aggregate income share, the shift from 2015 to 2016 is as follows:
The growth in
inequality is even starker when traced from 2007, the year before the Wall
Street crisis.
The data reflects
income and not wealth, thereby providing an incomplete and conservative
indication of the scale of inequality. Even within the highest quintile, the
income share increased only for the top 10 percent, and, in particular, the top
5 percent.
Household income
The corporate media
has portrayed the report as a sign of positive income growth, since it shows a
slight rise in median income of 3.2 percent from 2015 to 2016.
But according to
the Census data, the earnings of “full-time, year-round workers” remained
stagnant. For men in this category, a total of 63.9 million people, earnings
declined by 0.4 percent, from $51,859 in 2015 to $51,640 in 2016. For women in
this category, 47.2 million people, there was a minor increase, 0.7 percent,
from $41,257 in 2015 to $41,554 in 2016. In other words, families with 2 adults
working full-time saw a paltry $78 increase in their yearly earnings from 2015
to 2016.
Claims of rising
incomes mask the growth of inequality. The Census data shows that the household
income of the 90th percentile (the 100th being the highest) was 12.53 times
higher than the household income of the 10th percentile in 2016, up from 12.23
times higher in 2015 and 11.18 times higher in 2007. The degree to which income
is concentrated in the richest 10 percent of the population is exemplified by
the fact that the 5th percentile boasted a household income 3.82 times higher
than the 50th percentile in 2016, up from 3.79 times in 2015 and 3.52 in 2007.
As Bloomberg
News reported Wednesday, “Since 2007, average
inflation-adjusted income has climbed more than 10 percent for households in
the highest fifth of the earnings distribution, and it’s fallen 3.2 percent for
the bottom quintile. Incomes of the top 5 percent jumped 12.8 percent over the
period.”
For the working
class, any income increase was transferred to the corporate elite in the form
of rising debt payments and increasing living expenses, especially for health
care.
According to
figures from eHealth, a large private health exchange, average deductibles for
families rose 5 percent from 2016 to 2017 (a year after the period covered by
the Census report) and average individual premiums rose 22 percent over the
same period.
The rising cost of
student debt alone largely erases income increases seen by some young people.
According to the Census, those aged 15 to 24 saw an income increase of 13.9
percent, from $36,564 in 2015 to $41,655 in 2016, while incomes for young
people aged 25 to 34 rose 4.9 percent, from $58,091 to $60,932, nearly double
the percentage increase for older age groups.
However, in 2016,
student debt rose to an average of $30,000 per young person, up 4 percent from
2015, eliminating over 80 percent of the income rise for 25-34 year olds. For
15 to 24 year olds, the $4,000 increase in median income would hardly cover one
sixth of the average debt payment, let alone make up for the fact that young
people face a future in which they are unlikely to receive a pension, Social
Security or Medicare.
Rising debt levels are not a phenomenon limited to young people.
A Bloomberg report
from August 10 notes that credit card defaults increased from the beginning of
2015—when roughly 2.5 percent of debt holders defaulted—to the end of 2016,
when the total hit 3 percent. This figure subsequently climbed in 2017 to reach
3.49 percent.
Bloomberg notes: “After
deleveraging in the aftermath of the last US recession, Americans have once
again taken on record debt loads that risk holding back the world’s largest
economy... Household debt outstanding--everything from mortgages to credit
cards to car loans--reached $12.7 trillion in the first quarter [2017],
surpassing the previous peak in 2008 before the effect of the housing market
collapse took its toll, Federal Reserve Bank of New York data show.”
“For most
Americans,” the report continues, “whose median household income, adjusted for
inflation, is lower than it was at its peak in 1999, borrowing has been the
answer to maintaining their standard of living. The increase in debt helps
explain why the economy’s main source of fuel is providing less of a boost than
in the past. Personal spending growth has averaged 2.4 percent since the
recession ended in 2009, less than the 3 percent of the previous expansion and
4.3 percent from 1982-90.”
The Bloomberg report
explains that income from wages minus household debt trended downward in 2015,
meaning that debt is rising faster than wages, causing a loss of roughly $500
billion across the US economy in the space of just one year.
Poverty rate
Though the Census
report shows that the poverty rate declined from 13.5 percent of households in
2015 to 12.7 percent in 2016, this figure is substantially higher than the 11.3
percent level that prevailed in 2000. In reality, individuals and families must
make 2.5 to 3 times the official poverty rate of $12,000 for an individual,
$15,500 for a married couple and $25,000 for a family of four just to make ends
meet.
What the data
really shows is that the poorest half of the country--over 150 million
people--is in a desperate financial position, with the next poorest 40 percent
facing constant financial strain and a declining share of the national income.
In regard to poverty, the Census Bureau maintains figures that go up only to
200 percent of the official poverty level. The latest report shows that 95
million people—29.8 percent of the population—fall into this category. The
share of those under the age of 18 in this category is much higher--39.1
percent.
This is the context
for the drive by the Trump administration and both big business parties to
slash corporate taxes, impose a health care “reform” that will increase costs
for millions of people, and accelerate the transfer of wealth from the working
class to the financial aristocracy.
Census Bureau: Mens’
Wages Remain Below 1973 Levels

AP
Photo/David Goldman
Americans’ median pay packets have been flat since 1973, even
though the vastly expanded federal government has justified its own salaries
and its many massive spending and policy programs as a sure-fire way to
boost education, productivity, and wages.
The
colossal 44-year failure of the federal government to help grow American men’s
wages — or even to reduce poverty rates — is laid bare in the latest
report from the Census Bureau, “Income
and Poverty in the United States: 2016.”
The dense report includes
myriad detailed tables of data around one shocking chart, which reveals no
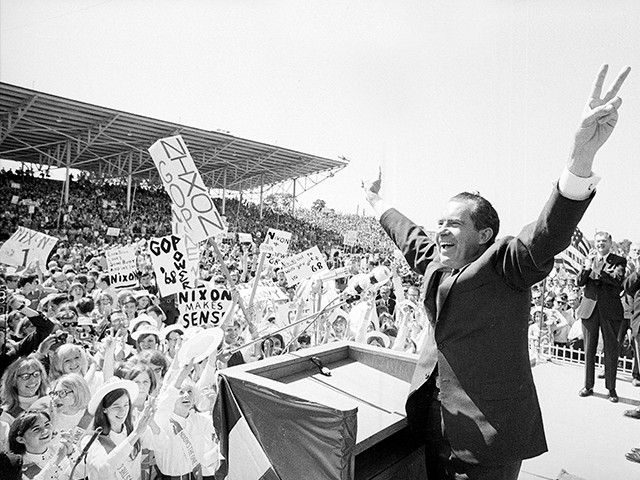
growth in men’s wages for the past 44 years, or since President Richard Nixon
was beginning his second term in office.
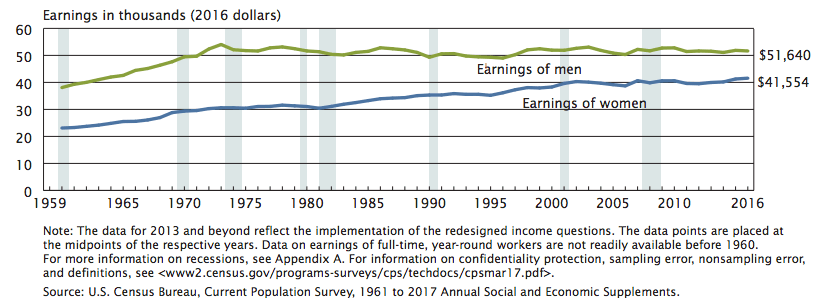
Median earning of full-time, year-round workers, 15 years and
older, 1960 to 2016.
The sudden flatline
followed a 31 percent rise in all men’s median wages from 1960 to 1972.
During the 44-year period
since 1973, income among women grew by roughly 30 percent as more skilled and
trained women entered the market, gained experience, and were promoted to
better-paying jobs. Those opportunities and contributions are good news — but
they do not change the reality that men’s income has been flat for 44 years.
In fact, the report notes
that “the real median earnings of full-time, year-round working men were 1.1
percent lower in 2016 than in 2007.”
There
are many explanations for the flat income, such as the massive growth in the
labor supply when 30 million additional American women and roughly 30 million
immigrants joined in the marketplace competition for good jobs. For example, a
pro-immigration panel at the prestigious National Academies of Science
estimated in 2016 that the huge government-imposed inflow of immigrants
since 1965 has imposed a hidden 5 percent “immigration tax” on Americans’ pay
packets.
Technology has made many
individuals workers more productive but also sidelined many others, such
as newspaper printers and steelworkers. Peaceful international trade has
allowed men to sell more products overseas but also allowed employers to hire
foreign workers instead of Americans. Whatever the combinations of reasons, the
mid-point for men’s income has been flat for 43 years, according to the Census
Bureau.
The flat-earnings chart
needs some explanation:
It shows only
inflation-adjusted, pre-tax pay packets, so it excludes the impact of
inflation, taxes and government benefits, such as food-stamps and tax-breaks
for children, or of Obamacare’s subsidies and spending obligations.
It shows median income,
which is the midpoint of the income scale. Half the people earn above the line,
half the people earn below the line. Average income would be higher, but less
revealing, because a higher share of income is going to the highest earners, compared
to back in the 1970s.
The chart shows the income
of year-round, full-time workers, excluding part-workers or seasonal workers,
or those who work on-and-off under contracts. The chart does not make
distinctions by race.
The chart shows
individuals’ income, not the income of households, which has fluctuated as
the average number of children or adults has declined.
The chart only shows
income, but not the quality of goods in the stores, such as Starbucks coffee,
cheap products imported from China, high-tech music players, improved autos or
better health-care. That rise in product quality from competing companies — not
claimed policy improvements from federal agencies — has provided the vast
majority of material gains for Americans amid flat incomes.
The median earnings for all
men employed year-round was $51,640 in 2016, which is still far below the
$54,030 earned by full-time men in 1973. It is also below the $51,938 earned in
the 2000 Internet boom, or the $52,222 earned in the 2007 property bubble when
large-scale legal and illegal immigration provided employers with millions of
alternative imported workers.
The post-1973 reality of
flat income is a huge contrast to the rapid growth from 1960 up to the 1973 oil
shock and the reopened inflow of immigrant labor after 1965. During the
twelves years 1960 to 1972, the median average wages for all males — including
minorities, seasonal workers, and contract workers — rose from by 31 percent,
from $31,926 to $41,013.
When the income of all men
is gauged, the Bureau concluded that all men’s median income in 1973 was
$41,935. It dropped after 1973 and rose back up to $43,360 in 1999 as companies
competed for the few unemployed workers during the first Internet boom. Income
crashed in 2008 to a depression-low of $39,636 in 2012 once the federal
government’s real-estate bubble burst. Since then, income has slowly climbed
back to $42,220 in 2016 amid the continuous public protest against the federal
government’s cheap-labor economic strategy, which is exemplified by the
bipartisan 2013 “Gang of Eight” amnesty legislation.
Other data in the report
shows that the nation’s poverty rates have barely budged since the 1960s,
although many people in the United States are wealthier than many people n
Europe. For example, the percentage of American said to be in poverty was 11.1
percent in 1973 and 12.7 percent in 2016.
That national poverty rate
climbed, in part, because of the population of Latinos spiked from 10.8 million
in 1973 to 57.6 million in 2016. Poverty among Latinos was 19 percent in
2016, little changed from 1973.
The report also noted that:
The official poverty rate
decreased by 0.8 percentage points between 2015 and 2016. At 12.7 percent, the
2016 poverty rate is not statistically different from 2007 (12.5 percent), the
year before the most recent recession.
In real terms, median
earnings of full-time, year-round working women in 2016 were 2.3 percent higher
than their 2007 median, the year before the most recent recession. The real
median earnings of full-time, year-round working men were 1.1 percent lower in 2016
than in 2007.
In 2017, the number and
percentage of shared households remained higher than in 2007, the year before
the most recent recession. In 2007, 17.0 percent of all households
were shared households, totaling 19.7 million households. In 2017, 19.4
percent of all households were shared households, totaling 24.6 million
households.
OBAMA-CLINTONOMICS to serve the
filthy rich
The same period has seen a massive growth of social inequality,
with income and wealth concentrated at the very top of American society to an
extent not seen since the 1920s.
“This study follows reports released over
the past several months documenting rising mortality rates among US workers due
to drug addiction and suicide, high rates of infant mortality, an overall
leveling off of life expectancy, and a growing gap between the life expectancy
of the bottom rung of income earners compared to those at the top.”
A
'Read-My-Lips' Moment for Trump?


President Donald J. Trump participates a Hurricane Irma briefing
call with FEMA Administrator William "Brock" Long, Monday, Sept. 11,
2017, joined by White House Chief of Staff Gen. John Kelly, left; Homeland
Security and Counter Terrorism Adviser Thomas Bossert, right, and Deputy
Homeland Security Adviser John J. Daly, seated, in the Oval Office at the White
House in Washington, D.C. ( Official White House Photo by Shealah Craighead)
"Having
cut a deal with Democrats for help with the debt ceiling, will Trump seek a
deal with Democrats on amnesty for the 'Dreamers' in return for funding for
border security?"
The answer
to that question, raised in my column a week ago, is in. Last night, President
Donald Trump cut a deal with "Chuck and Nancy" for amnesty for
800,000 recipients of the Deferred Action for Childhood Arrivals program who
came here illegally as youngsters, in return for Democratic votes for more
money for border security.
According
to preening Minority Leader Pelosi, the agreement contains not a dime for
Trump's Wall, and the "Dreamers" are to be put on a long glide
"path to U.S. citizenship."
Trump denies
this is amnesty, and says the Wall comes later.
Fallout?
Among the most enthusiastic of
Trump backers, disbelief, disillusionment
and wonderment at where we go from here.
Trump's
debt-ceiling deal cut the legs out from under the GOP budget hawks. But amnesty
would pull the rug out from under all the folks at those rallies who cheered
Trump's promise to preserve the country they grew up in from this endless Third
World invasion.
For make
no mistake. If amnesty is granted for the 800,000, that will be but the first
wave. "There are reasons no country has a rule that if you sneak
in as a minor you're a citizen," writes Mickey Kaus, author of
"The End of Equality," in The Washington Post.
"We'd
be inviting the world. ... (An amnesty) would have a knock-on effect. Under
'chain migration' rules established in 1965 ... new citizens can bring in their
siblings and adult children, who can bring in their siblings and in-laws until
whole villages have moved to the United States.
"(T)oday's
690,000 dreamers would quickly become millions of newcomers who may well be
low-skilled and who would almost certainly include the parents who brought them
— the ones who in theory are at fault."
Trump is
risking a breach in the dam. If the populists who provided him with decisive
margins in Ohio, Wisconsin, Michigan and Pennsylvania feel betrayed, it's hard
to blame them.
Why did
Trump do it? Clearly, he relished the cheers he got for the debt ceiling deal
and wanted another such victory. And with the rampant accusations of a lack of
"compassion" for his cancellation of the temporary Obama
administration amnesty, he decided he had had enough heat.
It is not
easy to stand up for long to the gale force winds of hostile commentary that
blow constantly through this city.
Trump's
capitulation, if that is what turns out to be, calls to mind George H. W.
Bush's decision in 1990 to raise the Reagan tax rates in a deal engineered for
him by a White House-Hill coalition, that made a mockery of his "Read my
lips! No new taxes!" pledge of 1988.
For
agreeing to feed the beast of Big Government, rather than cut its rations as
Reagan sought to do, Bush was called a statesman.
By the
fall of '92, the cheering had stopped.
Can Trump not know that those congratulating him for his
newfound flexibility will be rejoicing, should Bob Mueller indict his family
and his friends, and recommend his impeachment down the road?
What makes
pre-emptive amnesty particularly disheartening is that the Trump policy of
securing the border and returning illegal immigrants to their home countries
appears, from a Census Bureau report this week, to be precisely the
prescription America needs.
In 2016,
paychecks for U.S. households reached an average of $59,039, up 3.2 percent
from 2015, a year when they had surged.
U.S.
median household income is now at its highest ever.
Yet there
are inequalities. Where the median family income of Asian-Americans is above
$81,400, and more than $65,000 for white Americans, the median family income of
Hispanic families is $47,675, and that of African-American households far less,
$39,490.
Consider.
Though black Americans are predominantly native-born, while high percentages of
Hispanics and Asians are immigrants, from the Census numbers, Hispanics earn
more and Asians enjoy twice the median family income of blacks, which is below
where it was in 2000.
Still,
black America remains steadfastly loyal to a party that supports the endless
importation of workers who compete directly for jobs with them and their
families. Writes Kaus, "The median hourly wage (of DACA recipients) is
only $15.34, meaning that many are competing with hard-pressed, lower-skilled
Americans."
Looking
closer at the Census Bureau figures, Trumpian economic nationalism would appear
to have its greatest appeal to the American working class, a huge slice of
which is native-born, black and Hispanic.
The
elements of that policy?
Secure the
border. Halt the invasion of low-wage workers, here legally and illegally, from
the Third World. Tighten the labor market to force employers to raise wages in
our full-employment economy. Provide tax incentives to companies who site
factories in the USA. Impose border taxes on the products of companies who move
plants abroad.
Put
America and American workers first.
Will any
amnesty of undocumented workers do that?
Patrick
J. Buchanan is the author of a new book, "Nixon's White House Wars: The
Battles That Made and Broke a President and Divided America Forever."