TRUMP’S SECRET
AMNESTY, WIDER OPEN BORDERS DOCTRINE TO KEEP WAGES DEPRESSED.
"During the same month that
Schlafly had backed Trump for his “America First”
agenda, Nielsen’s committee
released an ideologically-globalist report, promoting
the European migrant crisis
as a win for big business who would profit greatly
from a never-ending stream
of cheap, foreign
migrants."
STAGNANT WAGES and the Dem Party’s obsession with open borders, amnesty and no damned legal need apply!
THE LA RAZA
SUPREMACY PARTY for OPEN BORDERS, AMNESTY, NON-ENFORCEMENT, NO E-VERIFY and no
Legal need apply!!!
The Democratic Party used to be the party of blue
collar America- supporting laws and policies that benefited that segment of the
U.S. population. Their leaders may still claim to be advocates for
American working families, however their duplicitous actions that betray
American workers and their families, while undermining national security and
public safety, provide clear and incontrovertible evidence of their lies…. MICHAEL
CUTLER …FRONTPAGE mag
Congress Floods White-Collar Labor Markets

Federal data shows that legal immigrants are filling a growing share of several white-collar professions which have seen little salary growth since 2000.
The data was posted by the Center for Immigration Studies, and it shows how Congress imports foreign-born immigrants and visa-workers to raise the labor supply by roughly 50 percent in several white-collar science and technology jobs, ensuring much lower salaries for Americans in those flooded job markets.
The CIS study looked at the percentage of foreign-born workers in 474 separate occupations defined by the Department of Commerce. The group reported:
There are 65 occupations in which 25 percent or more of the workers are immigrants (legal and illegal). In these high-immigrant occupations, there are still 16.5 million natives — accounting for one out of eight natives in the labor force…there are just 24 occupations out of 474 in which illegal immigrants comprise at least 15 percent of workers …we find that only 4 percent of illegal immigrants and 2 percent of all immigrants work on farms.
The loss of wages and status is obvious in the jobs where migrants have doubled or nearly doubled the supply of labor. For example, legal and illegal migrants hold a slight majority of jobs in blue-collar agricultural sorting, construction plasterers, sewing-machine operators, tailors, and miscellaneous agricultural workers. Immigrants also comprise 40 percent or more of eight additional jobs as maids, textile workers, taxi drivers, translators, roofers, and painters.
But the government-delivered flood of new labor has reached up to many once-prestigioushigh-tech white-collar jobs that were widely seen as a hard-earned pathway to a prosperous and secure future.
Foreign-born workers comprise 43 percent of medical and biological scientists, 38 percent of physical scientists, 38 percent of software developers, 36 percent of computer engineers, 31 percent of economists, 28 percent of physicists and doctors, 27 percent of clients, 27 percent of electronics engineers and 25 percent of software programmers, according to the CIS data.
These are huge inflows. For example, if 33 percent of people in a career are immigrants, then the government has raised the labor supply in that career by 50 percent.
Those percentages are likely to increase further if Congress approves the HR 392 proposal by GOP Rep. Kevin Yoder to lift the “country caps” on employer-sponsored immigrants, or implements donor demands for more visa-workers, or if President Donald Trump drops his Four Pillars immigration reform plan or quits his regulatory efforts to shrink the visa-worker programs.
In February 2018, an alliance of Democrats and business-first Republicans — backed by business groups — blocked Trump’s Four Pillars pro-American reform in the Senate.
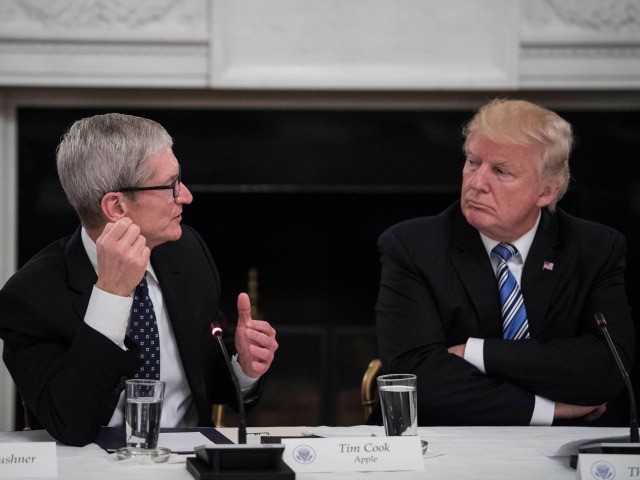
US President Donald Trump listens to Apple CEO Tim Cook speak during an American Technology Council roundtable at the White House in Washington, DC, on June 19, 2017.
The high inflow of extra workers ensured by Congress has a large impact on wages, according to Economics 1o1 calculations. For example, the 2016 report on immigration by the National Academy of Sciences reported that Americans lose 5.2 percent of their wages and salaries when the government uses immigrants to raise the labor supply by 16.5 percent.
The lost 5.2 percent of income does not go to immigrants or disappear into the air — it is transferred to employers and investors in the form of almost $500 billion in extra profits per year. Those transfers supercharge New York’s stock market.
One of the academics serving on the NAS group, George Borjas of Harvard, used his blogto translate the academies’ overly complex description of the immigration tax:
The calculation of the immigration surplus reported in Chapter 4 of the NAS report assumes that GDP is $17.5 trillion; that 65% of GDP goes to workers; and that 16.5% percent of the workforce is foreign-born. The report also says that “the current stock of immigrants lowered wages by 5.2 percent.”Because only 65% of GDP goes to workers, that means that the total earnings of all workers is $11.4 trillion (or 0.65 × 17.5). But because only 16.5% of workers are foreign-born, the fraction of total earnings that goes to native workers is $9.5 trillion (or 0.835 × 11.4). The NAS report says that native earnings fell by 5.2 percent, so that the wage transfer from native workers to employers is $494 billion (or 0.052 × 9.5).
So the 5.2 percent transfer tax is imposed when where government-supplied immigrants or visa-workers — such as H-1Bs, L-1s or H-2As — provide 16.5 percent of the labor. But the immigrant population is far higher in the high-tech careers where government-supplied immigrants and visa-workers can jointly add 30 percent or 40 percent of the labor.
Legal immigrants are equally impacted by this government-arranged transfer because they work under similar economic pressure as Americans. They gain by moving to the United States but lose when the government moves another cohort of immigrants into their sector.
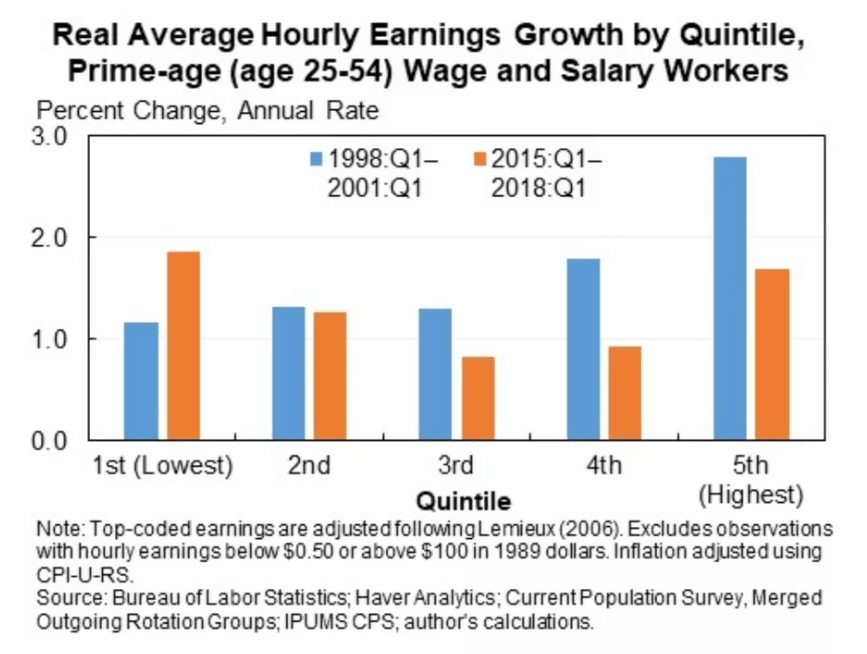
The growing economic impact of white-collar immigration helps explain why blue-collar wages are rising faster than white-collar wages in the current economic expansion. Jason Furman, a former economic advisor to President Barack Obama, used orange bars to show the white-collar slump:
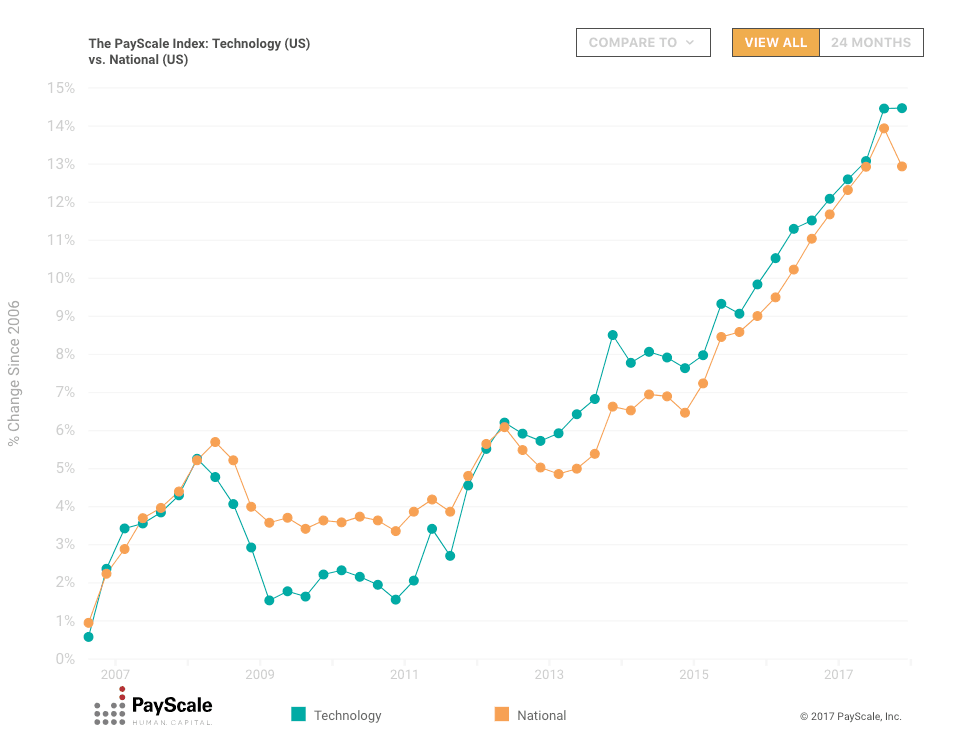
Overall, salaries for technology jobs have barely kept ahead of pre-inflation average salaries nationwide over the last decade, according to Payscale:
But the government data provided by CIS shows that many culture-intensive jobs have largely escaped the diversity that many progressives promote for others.
So far, immigrants comprise just 5 percent of business fundraisers, 7 percent of lawyers, P.R specialists, and archivists, 8 percent of writers and authors, urban planners, editors, technical writers, law clerks, and religious directors, 9 percent of psychologists, event planners, therapists and human-resources people, and 10 percent of advertising managers, camera operators, social workers and paralegals.
Nonetheless, the rising inflow of immigrants is also beginning to flood into many of these culture-related jobs.
Twelve percent of photographers, actors, social scientists, clergy, and “news analysists, reporters and correspondents” are immigrants. “Native-born reporters who work at English-language media outlets face … modest levels of competition from immigrants,” CIS reported.
Thirteen percent of chief executives, human resources managers, and artists are immigrants.
Fourteen percent of therapists are immigrants.
Fifteen percent of designers, 19 percent of architects, financial analysts, and computer managers are immigrants.
Twenty percent of pharmacists and 22 percent of teachers are immigrants.
However, people who work for government and regulated industries face little competition. The jobs with the fewest percentage of immigrants include firefighters, soil-conservation scientists, jailers, powerline installers, detectives, country clerks, air traffic controllers, police officer, and teachers.
Each year, four million young Americans enter the workforce — and the government imports 1 million legal immigrants, replenishes the population of roughly 1.5 million white-collar guest workers, and does little to repatriate the resident population of roughly 8 million illegal immigrants.
Overall, the Washington-imposed economic policy of economic growth via immigration shifts wealth from young people towards older people by flooding the market with cheap foreign labor.
That process spikes profits and Wall Street values by cutting salaries for manual and skilled labor offered by blue-collar and white-collar employees. The policy also drives up real estate prices, widens wealth-gaps, reduces high-tech investment, increases state and local tax burdens, hurts kids’ schools and college education, pushes Americans away from high-tech careers, and sidelines at least 5 million marginalized Americans and their families, including many who are now struggling with opioid addictions. Immigration also pulls investment and wealth away from heartland states because investment flows towards the large immigrant populations living in the coastal states.
U.S. Election Meddling: Nationwide Voter Fraud, Importation of 15M
Foreign-Born Voters
Shelby Lum, Richmond
Times-Dispatch via The Associated Press
19 Jul 2018Washington, D.C.
As
the establishment media, GOP, and Democrats fret over the influence foreign
countries have on U.S. elections, the leading threats to the American
electorate remain nationwide voter fraud and mass immigration.
Though President Trump’s administration sought to thoroughly investigate
voter fraud through the
Presidential Commission on Election Integrity, the board
was handed off to the
Department of Homeland Security (DHS) in order to bypass obstruction from
national Democrats who refused to turn over voter data.
Voter
Fraud
The number of convictions against voter fraud continues to rise, with now
nearly 940 criminal convictions on the books across the U.S., according to the
latest data from the
Heritage Foundation.
Likewise, the
number of cases of voter fraud has risen. Heritage’s Voter Fraud Database now
features 1,071 cases of voter fraud that spans across 47 states.
In the most recent study by the
Government Accountability Institute (GAI) on voter fraud, the think tank
found 8,471 high likely cases of double voting. About 7,271 of those
cases were inter-state double voting, while the remaining 1,200 cases were
of intra-state double voting.
“The
probability of correctly matching two records with the same name, birthdate,
and social security number is close to 100 percent,” the GAI report noted.
Kansas Secretary of State and gubernatorial candidate
Kris Kobach is fighting in his state to enforce voting laws that would mandate
voters prove their U.S. citizenship. This effort has currently been
halted by the left-wing ACLU organization and a circuit judge who recently
claimed that it was unconstitutional for a state to demand voters provide
their U.S. citizenship records. Years ago, proof of citizenship voting laws
were upheld as fully constitutional.
“Compare
[Russia meddling in the 2016 presidential campaigns] to the kind of foreign
influence in the actual election numbers in foreign nationals voting,” Kobach
told Breitbart News. “That’s real and much more consequential and it’s
happening all over the country.”
Kobach said
his expert witness in the suit with the ACLU over the proof of citizenship law
revealed that as many as 33,000 foreign nationals are on the voter rolls in
Kansas. For states like California, with the largest foreign-born population in
the country, the number of foreign nationals on the voter rolls is likely in
the hundreds of thousands or even the millions, Kobach says.
Mass
Immigration
Similarly, mass legal and illegal immigration to the U.S. continues to be
the largest driver of population increases and demographic shifts in the
country. Every year, more than 1.5 million immigrants are admitted to the
country. The U.S. has imported more than ten million immigrants in the
last decade.
The vast
majority of foreign nationals arrive through the process known as “chain
migration,” where newly naturalized citizens can bring an unlimited number of
foreign relatives to the U.S. Every two new immigrants to the country bring an
additional seven foreign relatives with them.
As Breitbart News has extensively reported, the U.S. is
on track to import about 15 million foreign-born voters by the year 2038. That
is nearly quadruple the size of the annual number of U.S. births; about
four million American babies are born every year.
Through chain
migration alone, the U.S. will import about eight million foreign-born voters
in the next two decades.
The country’s
continued mass immigration policies are likely to hand over electoral dominance
to Democrats in statewide and national elections, Breitbart News has noted.
Analysis
conducted by Axios’s Chris Canipe and Andrew Witherspoon shows the
overwhelming trend of foreign-born populations voting Democrats into office
over Republicans.
Got any tips about the H-1B, L-1 and OPT programs? Email Neil Munro here or at NMunro@Breitbart.com.
No Justice for Taxpaying Americans
By Howie Carr
The Boston Herald, August 08, 2018 But the real double standard kicks in when the undocumented Democrat gets to the courtroom. A taxpaying American can only dream of the kid-gloves treatment these Third World fiends get.
Here’s a 2016 headline: “If Springfield market owner illegally cashing food stamps had been U.S. citizen punishment would have been greater, judge says.”
This one involved a 56-year-old Dominican bodega owner who was running an EBT-card scam for illegal immigrants in Springfield — stop me if you’ve heard this one before. He stole $38,000 and didn’t do a day in jail. As Judge Tina Page said, “Had he been a citizen of the U.S. he would in all likelihood be serving a substantial sentence.”
But if he’d been imprisoned he’d have been deported, and God knows we don’t want to deport Dominican welfare fraudsters — or Dominican heroin dealers.
Freeing Dominican heroin dealers (and future cop killers) is the specialty of Superior Court Judge Timothy Feeley, who cut loose a Dominican heroin dealer with no prison time, as the prosecutor put it, “to help him avoid deportation.”
Are you starting to notice a pattern here? Sometimes law-abiding taxpayers get murdered because of this double standard of justice for welfare-collecting noncitizens.
http://www.bostonherald.com/news/columnists/howie_carr/2018/08/carr_no_justice_for_taxpaying_americans
Get rid of 40 million looting Mexicans and we resolve our housing and jobs crisis and end the $150 billion Mex welfare state in our open borders!
Our government is too busy easing illegals over the borders!
THE NEW PRIVILEGED CLASS: Illegals!
This is why you work From Jan - May paying taxes to the government ....with the rest of the calendar year is money for you and your family.
He qualifies for Section 8 housing and subsidized rent.
He qualifies for food stamps.
He qualifies for free (no deductible, no co-pay) health care.
His children get free breakfasts and lunches at school.
He requires bilingual teachers and books.
He qualifies for relief from high energy bills.
If they are or become, aged, blind or disabled, they qualify for SSI.
Once qualified for SSI they can qualify for Medicare. All of this is at (our) taxpayer's expense.
Taxpayers provide Spanish language signs, bulletins and printed material.
He and his family receive the equivalent of $20.00 to $30.00/hour in benefits.
Working Americans are lucky to have $5.00 or $6.00/hour left after Paying their bills and his.
Cheap labor? YEAH RIGHT! Wake up people!
By Howie Carr
The Boston Herald, August 08, 2018 But the real double standard kicks in when the undocumented Democrat gets to the courtroom. A taxpaying American can only dream of the kid-gloves treatment these Third World fiends get.
Here’s a 2016 headline: “If Springfield market owner illegally cashing food stamps had been U.S. citizen punishment would have been greater, judge says.”
This one involved a 56-year-old Dominican bodega owner who was running an EBT-card scam for illegal immigrants in Springfield — stop me if you’ve heard this one before. He stole $38,000 and didn’t do a day in jail. As Judge Tina Page said, “Had he been a citizen of the U.S. he would in all likelihood be serving a substantial sentence.”
But if he’d been imprisoned he’d have been deported, and God knows we don’t want to deport Dominican welfare fraudsters — or Dominican heroin dealers.
Freeing Dominican heroin dealers (and future cop killers) is the specialty of Superior Court Judge Timothy Feeley, who cut loose a Dominican heroin dealer with no prison time, as the prosecutor put it, “to help him avoid deportation.”
Are you starting to notice a pattern here? Sometimes law-abiding taxpayers get murdered because of this double standard of justice for welfare-collecting noncitizens.
http://www.bostonherald.com/news/columnists/howie_carr/2018/08/carr_no_justice_for_taxpaying_americans
A detailed look at immigrants (legal and illegal) and natives across occupations
An Excel file with information on all occupations is available here.
Steven A. Camarota is the director of research and Karen Zeigler is a demographer at the Center. Jason Richwine, PhD, is an independent public policy analyst based in Washington, D.C., and a contributing writer at National Review.
If immigrants "do jobs that Americans won't do", we should be able to identify occupations in which the workers are nearly all foreign-born. However, among the 474 separate occupations defined by the Department of Commerce, we find only a handful of majority-immigrant occupations, and none completely dominated by immigrants (legal or illegal). Furthermore, in none of the 474 occupations do illegal immigrants constitute a majority of workers.
Notable findings:
- Of the 474 civilian occupations, only six are majority immigrant (legal and illegal). These six occupations account for 1 percent of the total U.S. workforce. Moreover, native-born Americans still comprise 46 percent of workers in these occupations.
- There are no occupations in the United States in which a majority of workers are illegal immigrants.
- Illegal immigrants work mostly in construction, cleaning, maintenance, food service, garment manufacturing, and agricultural occupations. However, the majority of workers even in these areas are either native-born or legal immigrants.
- Only 4 percent of illegal immigrants and 2 percent of all immigrants do farm work. Immigrants (legal and illegal) do make up a large share of agricultural workers — accounting for half or more of some types of farm laborers — but all agricultural workers together constitute less than 1 percent of the American work force.
- Many occupations often thought to be worked overwhelmingly by immigrants (legal and illegal) are in fact majority native-born:
- Maids and housekeepers: 51 percent native-born
- Taxi drivers and chauffeurs: 54 percent native-born
- Butchers and meat processors: 64 percent native-born
- Grounds maintenance workers: 66 percent native-born
- Construction laborers: 65 percent native-born
- Janitors: 73 percent native-born
- There are 65 occupations in which 25 percent or more of the workers are immigrants (legal and illegal). In these high-immigrant occupations, there are still 16.5 million natives — accounting for one out of eight natives in the labor force.
- High-immigrant occupations (25 percent or more immigrant) are primarily, but not exclusively, lower-wage jobs that require relatively little formal education.
- In high-immigrant occupations, 54 percent of the natives in those occupations have no education beyond high school, compared to 30 percent of the rest of the labor force.
- Natives tend to have high unemployment in high-immigrant occupations, averaging 9.8 percent during the 2012-2016 period, compared to 5.6 percent in the rest of the labor force. There were a total of 1.8 million unemployed native-born Americans in high-immigrant occupations.
- The stereotype that native-born workers in high-immigrant occupations are mostly older, with few young natives willing to do such work, is largely inaccurate. In fact, 34 percent of natives in high-immigrant occupations are age 30 or younger, compared to 29 percent of natives in the rest of labor force.
- Not all high-immigrant occupations are lower-skilled. For example, 38 percent of software engineers are immigrants, as are 28 percent of physicians.
- A number of politically influential groups face very little job competition from immigrants (legal and illegal). For example, only 7 percent of lawyers and judges and 7 percent of farmers and ranchers are immigrants, as are at most 9 percent of English-language reporters and correspondents.1
Full Results
The spreadsheet that accompanies this report gives the share of each occupation that is comprised of immigrant workers.
(You can also download the Excel spreadsheet here.)
Discussion
Because the American economy is so dynamic, with many factors impacting employment and wages, it would be a mistake to believe that every job taken by an immigrant is a job lost by a native. It would also be a mistake, however, to assume that dramatically increasing the number of available workers in high-immigrant occupations has no impact on the employment prospects or wages of natives. As our results indicate, at the most detailed level of analysis possible, there are very few occupations that are majority immigrant — just six out of 474 — and 46 percent of workers even in these high-immigrant occupations are native-born. Moreover, high-immigrant occupations employ less than 1 percent of all native workers and 3 percent of all immigrant workers.2 Therefore, speaking of "jobs Americans won't do" gives the false impression that the labor market is strictly segmented between immigrant and native jobs.
Of course, immigrants are much more concentrated in some occupations than in others, but a large number of native-born Americans still work in high-immigrant occupations. There are nearly 900,000 U.S.-born maids and housekeepers, for example, and 1.3 million native-born construction laborers. Clearly, natives are willing to do these jobs — in fact, they are doing them. Assertions by employers that it is impossible to hire Americans should therefore be treated skeptically. Given the large number of native-born Americans who already do "immigrant jobs", and given the 42 million working-age natives who are not currently in the labor force, it seems likely that increasing wages and benefits, improving working conditions, and changing recruitment practices could go a long way toward securing needed workers even in the absence of immigration.3
Illegal Immigrants. Illegal immigrants tend to be even more associated with the "jobs Americans won't do" mantra. And yet there are just 24 occupations out of 474 in which illegal immigrants comprise at least 15 percent of workers. There are 5.7 million natives in these high-illegal-immigrant occupations, 67 percent of whom have no education beyond high school. But in occupations that are made up of 5 percent or less illegal immigrants, 75.5 percent of natives have education beyond high school.4 This suggests that the impact of illegal immigration on wages and employment opportunities will be felt most by less-educated natives. More-educated natives will tend to avoid competition with illegal immigrants.
Agricultural Work. The tendency for immigrants to work in agriculture is often overestimated. In fact, we find that only 4 percent of illegal immigrants and 2 percent of all immigrants work on farms.5 Immigrants do make up a significant share of farm workers — accounting for half or more of some types of farm work. But only about one million people of any nativity work on farms in the United States, accounting for less than 1 percent of the entire civilian labor force of 160 million.6
State and Local Picture. This analysis focuses on the nation as a whole. Of course, the immigrant share of occupations will vary significantly at the state and local level. For example, a very high-immigration state like California will have more majority-immigrant occupations than a low-immigration state like Ohio. In low-immigrant areas, the overwhelming majority of workers are natives, even in low-wage, difficult jobs, meaning that when immigrants are not present natives do this type of work. Furthermore, we live in a national economy in which workers can and do move to higher-wage and lower-unemployment areas over time. Of native-born adults, 14.8 percent changed addresses in just the last year. Moreover, 38.4 percent live outside of their state of birth.7 In its large 2016 study of immigration, the National Academies of Sciences concluded that the effects of immigration are likely to be national in scope. Capital, labor, goods, and services can all move. This means that the impact of immigration is not confined to only those areas of the country where immigrants settle.8
Data and Methods
The data for this analysis comes from the public-use file of the combined five-year sample of the American Community Survey (ACS), covering the years 2012 through 2016. The file includes 7.6 million individuals in the civilian, non-institutionalized labor force, about 1.1 million of whom are immigrants. Persons in the labor force are either working or looking for work. Consistent with the way the government reports most labor force statistics, we confine our analysis to civilians 16 years of age and older and not living in institutions. Immigrants, who can also be referred to as the "foreign-born", are defined as persons living in the United States who were not U.S. citizens at birth. This includes people who are naturalized American citizens, legal permanent residents (green card holders), illegal aliens, and people on long-term temporary visas such as students or guestworkers. It does not include those born abroad to American parents or those born in outlying territories of the United States, such as Puerto Rico.
Identifying Illegal Immigrants. Illegal immigrants are present in Census data, but never explicitly identified by the Bureau. To determine which respondents are most likely to be illegal, CIS follows a methodology similar to those used by the Pew Research Center and the Center for Migration Studies.9 We start by eliminating immigrant respondents who are almost certainly not illegal — for example, spouses of natural-born citizens; veterans; people who receive direct welfare payments (except Medicaid for women who gave birth within the past year and for residents of certain states); people who have government jobs; Cubans (because of special rules for that country); immigrants who arrived before 1980 (because the 1986 amnesty should have already covered them); people in certain occupations requiring licensing, screening, or a government background check (e.g. doctors, pharmacists, and law enforcement); and people likely to be on student visas. The remaining candidates are weighted to replicate known characteristics of the illegal population (size, age, gender, country of origin, and state of residence) as determined by the Department of Homeland Security.10 The resulting illegal population closely approximates other published estimates.
Of course, all profiles of the illegal immigrant population carry significant uncertainty, and the illegal immigrant shares of various occupations included in the table are no exception. When those shares become small, we designate them as "less than 4 percent" (or a smaller percentage) to avoid false precision.
End Notes
1 The accompanying Excel spreadsheet shows that 12.3 percent of news analysts, reporters, and correspondents are immigrants (legal and illegal). However, if we exclude all immigrants in this job category that speak English less than very well, making it very unlikely they work at an English-language outlet, then only 9.2 percent of English-language reporters are immigrants. This is likely still a high estimate since some share of immigrants who speak English very well still work for foreign language media. The bottom line is that native-born reporters who work at English-language media outlets face only modest levels of competition from immigrants.
2 In this report, we follow the Census Bureau's approach of assigning unemployed people to the occupation they last worked, as long as they have worked within the previous five years.
3 In fairness to employers, getting some of the long-term unemployed back into the labor force is a challenge, but the challenge will be taken up only when immigration no longer provides a convenient alternative. For a longer discussion of this topic, see Amy Wax and Jason Richwine, "Low-Skill Immigration: A Case for Restriction", American Affairs, Winter 2017.
4 Figures are from the 2012-2016 public-use files of the American Community Survey.
5 For corroboration, the Pew Research Center also concluded in 2014 that "only 4 percent of unauthorized immigrant workers held farming jobs in 2014." See Jeffrey S. Passel and D'Vera Cohn, "Size of U.S. Unauthorized Immigrant Workforce Stable After the Great Recession", Pew Research Center, November 3, 2016.
6 The occupational codes for farm work are 6010, 6005, 6040, and 6050. The codes and names of the occupations are listed in the Excel spreadsheet.
7 Figures are from the 2012-2016 public-use files of the American Community Survey.
8 Francine D. Blau and Christopher Mackie, Eds., The Economic and Fiscal Consequences of Immigration, Washington, D.C.: National Academies Press, 2016, p. 161 (online version).
9 See Jeffrey S. Passel and D'Vera Cohn, "Overall Number of U.S. Unauthorized Immigrants Holds Steady Since 2009", Pew Research Center, September 20, 2016; and Robert Warren, "Democratizing Data about Unauthorized Residents in the United States: Estimates and Public-Use Data, 2010 to 2013", Journal on Migration and Human Security, Vol. 2, No. 4, 2014.
10 We chose the 2014 DHS estimates to represent the middle of the 2012-2016 period covered by the five-year ACS data used in this report. About 90 percent of illegal immigrants are thought to respond to the ACS. See Bryan Baker, "Estimates of the Unauthorized Immigrant Population Residing in the United States: January 2014", Department of Homeland Security, Office of Immigration Statistics, July 2017.
Topics: Wages, Jobs, and Poverty